

-
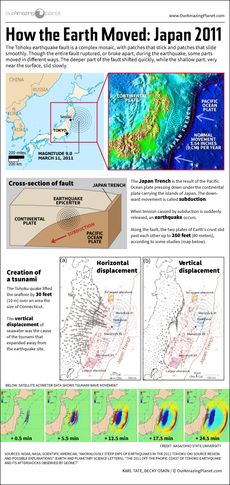 How Japan's 2011 Earthquake Happened (Infographic)
Huge stresses beneath the surface moved plates of the Earth's crust hundreds of feet horizontally and dozens of feet vertically.
-
 Our Amazing Planet Top to Bottom: Mountaintop to Ocean Trench (Infographic)
Explore the entire Earth's surface from highest peaks to mysterious depths.
-
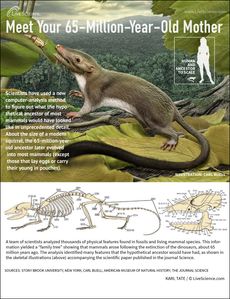 Mother of Mammals: Meet the Earliest Placental Mammal Ancestor (Infographic)
This tiny squirrel-sized creature would later evolve into a diversity of mammal species including humans.
-
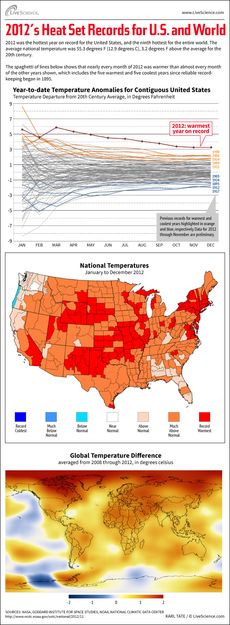 2012 Warmest Year on Record for U.S., 9th Warmest for World (Infographic)
Nearly every month of 2012 was warmer than in nearly every one of the years recorded since 1895.
-
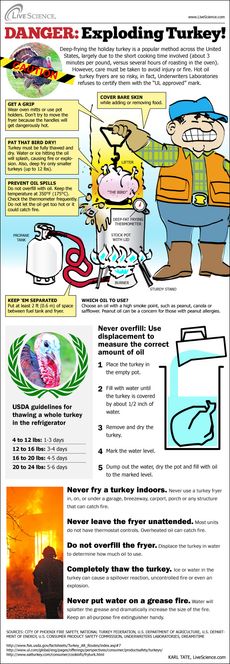 Avoiding Fried Turkey Disaster (Infographic)
The dangers in introducing icy frozen turkeys to a pot of searing hot fry oil. Just part of our wall to wall Thanksgiving coverage.
-
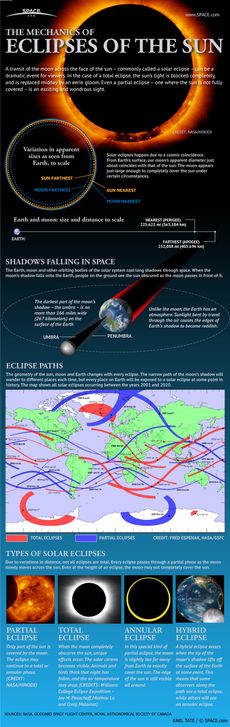 Solar Eclipses: An Observer's Guide (Infographic)
How Solar Eclipses Work: When the moon covers up the sun, skywatchers delight in the opportunity to see a rare spectacle.
-
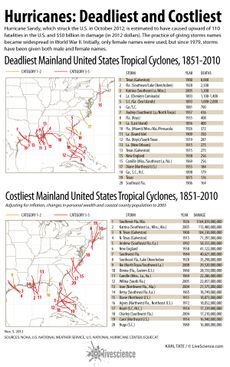 Deadliest and Costliest Hurricanes to Strike the US (Infographic)
The deadliest hurricane in the period since 1851 hit Texas in 1900 and claimed 8,000 lives.
-
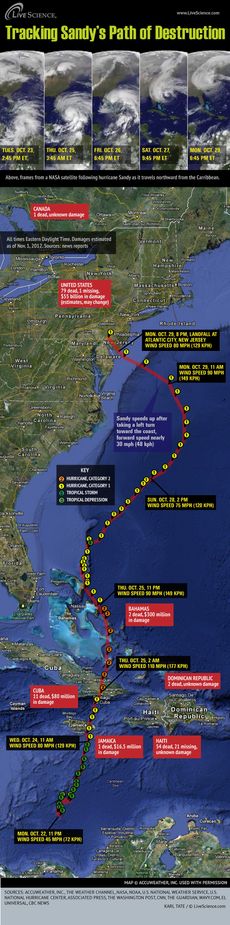 Timeline of Hurricane Sandy's Week of Destruction (Infographic)
Follow the path of hurricane Sandy as it casuses more than 150 deaths and billions of dollars in damages.
-
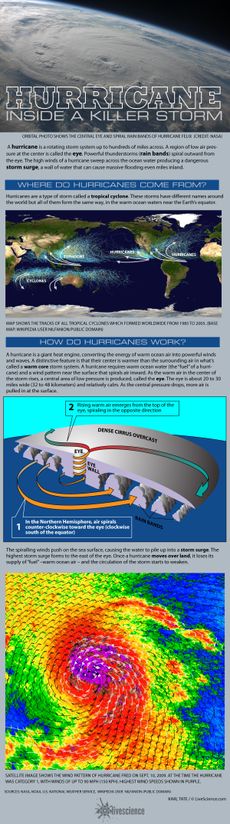 How Hurricanes Work (Infographic)
A look inside the giant heat engine that keeps a hurricane alive.
-
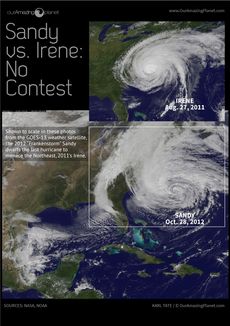 Storm Size Comparison: Irene vs. Sandy (Infographic)
Hurricane Irene was a billion-dollar disaster, but it is dwarfed in terms of size by Hurricane Sandy.
-
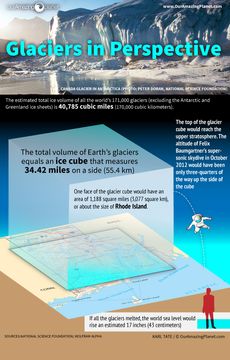 Ice in Perspective: Earth's Mountain Glaciers (Infographic)
If you took the ice in all of Earth's mountain glaciers, it would make a cube with 34-mile-long sides.
-
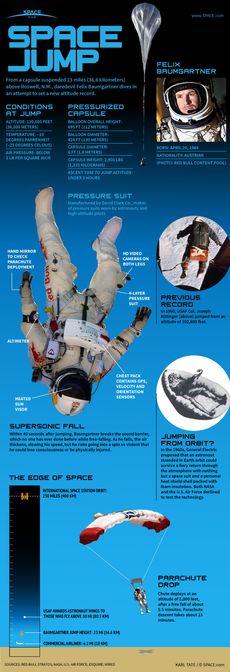 Space Jump: How Felix Baumgartner's Record-Breaking Supersonic Skydive Works(Infographic)
The daredevil's jump from 120,000 feet altitude requires the use of a space suit due to the low temperature and thin air.
-
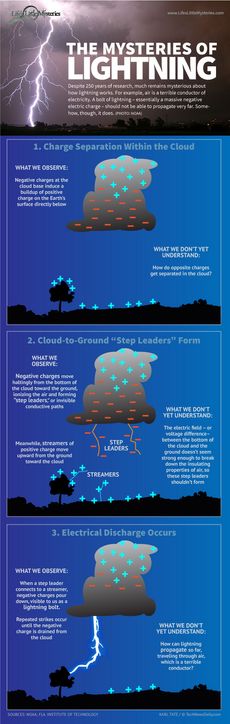 Infographic: How Lightning Works
Scientists know the basics of what happens during a lightning strike. But the details remain hazy.
-
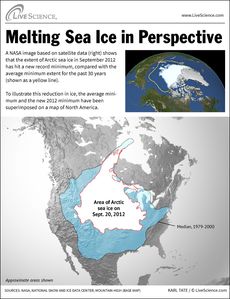 Arctic Sea Ice Hits a Record Minimum (Infographic)
A new NASA image based on satellite data shows that the extent of Arctic sea ice in September 2012 has hit a new record minimum, compared with the average minimum extent for the past 30 years.
-
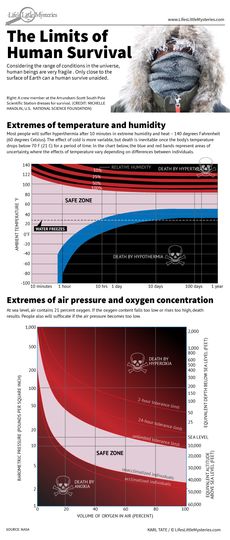 Infographic: The Limits of Human Survival
The human body can tolerate drastic departures from normal conditions. But what are its absolute limits?
-
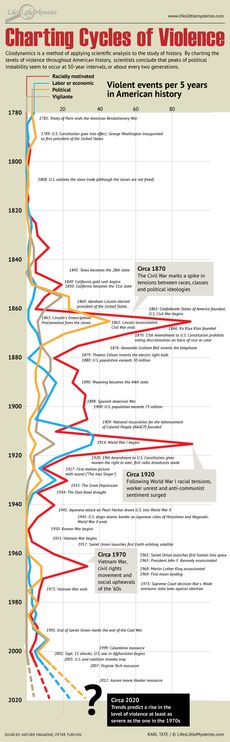 Infographic: Cycles of Violence in the United States
A scientist says that the United States experiences cycles of violence that peak every 50 years. If so, the next peak of violence will occur in 2020.
-
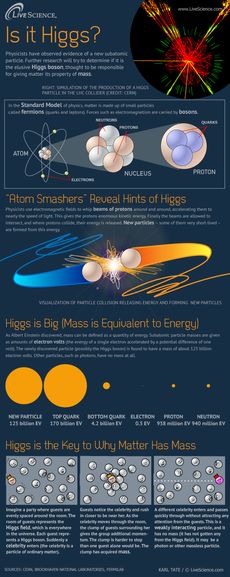 Will the Real Higgs Please Stand Up? (Infographic)
Researchers have observed a new, massive particle which they believe may be the Higgs boson.
-
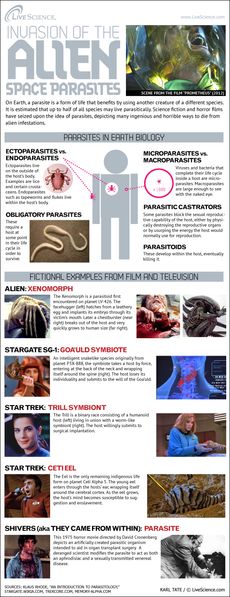 Alien Parasites Threaten Sci-Fi Space Travelers (Infographic)
Ridley Scott's "Prometheus" expands on themes introduced in his 1979 film "Alien," including the idea of parasitic life forms that incubate inside the human body.
-
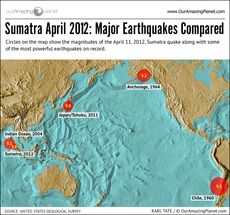 April 2012 Sumatra Quake: How it Stacks Up (Infographic)
The quake was a big one, but , here's how it compares to some record holders.
-
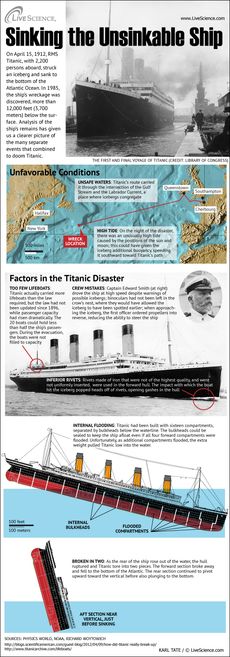 Why and How the Titanic Sank (Infographic)
A remarkable variety of elements came together to sink the famed steamship Titanic.
-
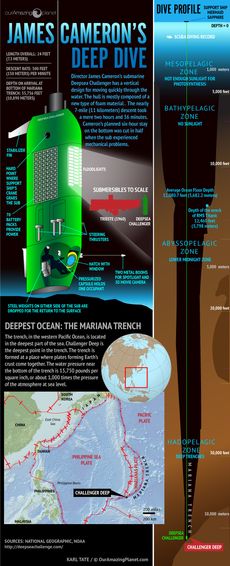 Into the Deep: James Cameron's Mariana Trench Dive (Infographic)
Where he's diving and how his submersible looks.
-
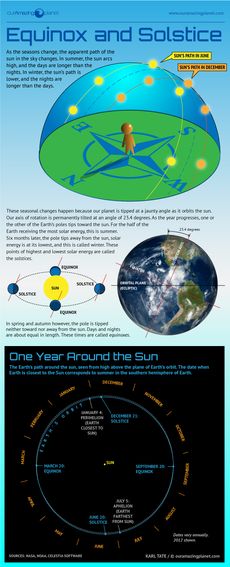 Season to Season: Earth's Equinoxes & Solstices (Infographic)
The tilt of the Earth during its yearly orbit creates the seasons, equinoxes and solstices.
-
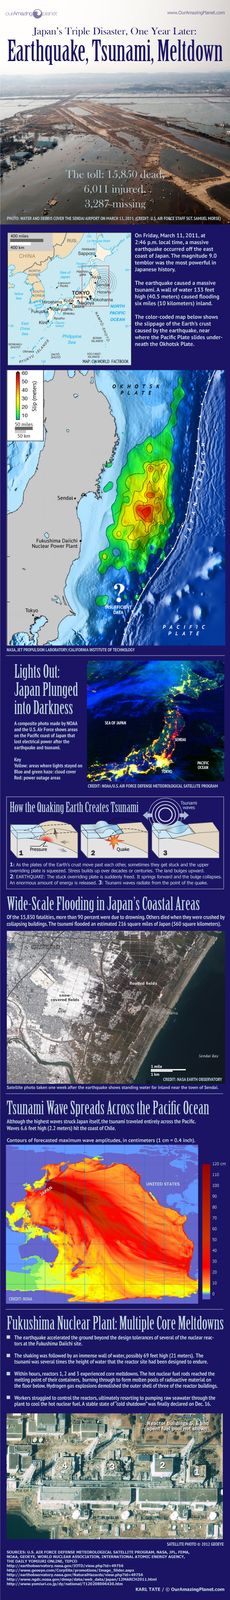 One Year Later: How the Earthquake & Tsunami Devastated Japan (Infographic)
The scope of the disaster and the havoc it wreaked.
-
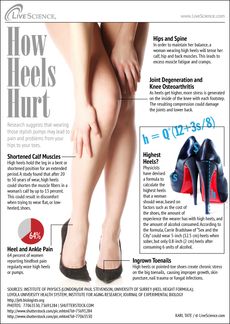 How High Heels Hurt (Infographic)
Problems from back pain to joint degeneration to ingrown toenails can accompany the wearing of those stylish pumps.


