


Warming Air Was Trigger for Antarctic Ice Shelf Collapse
It was clear to anyone who went to Antarctica in the summer of 2001-02 that it was an unusually warm one — record-setting, in fact — and just one in a series of warm austral summers.
That December, geologic oceanographer Eugene Domack, now at the University of South Florida, was part of an expedition sampling the Southern Ocean seafloor around the Antarctic Peninsula — then, as now, one of the fastest-warming places on the globe. Taking advantage of their proximity to the peninsula’s Larsen B ice shelf (a tongue of ice that floats on the sea and is fed by land-bound glaciers and ice streams), the group took a detour to check out the ice and sample some of the sediments from the waters around it.
The scientists knew that the ice shelf’s northern neighbor, the Larsen A, had disintegrated back in 1995, but still the sight of the Larsen B shocked them. What should have been alternating layers of compacted snow and ice, laid down each winter, was instead a huge solid layer of ice at the top of the ice shelf. Summer meltwater was forming large pools on the surface and tumbling off the edges into the ocean.

“There were waterfalls of water coming off the ice shelf,” Domack told Climate Central. “No one’s ever seen that.”
Antarctic Riddle: How Much Will the South Pole Melt? Melt of Key Antarctic Glaciers ‘Unstoppable,’ Studies Find Surging Seas: A Climate Central Sea Level Rise Analysis
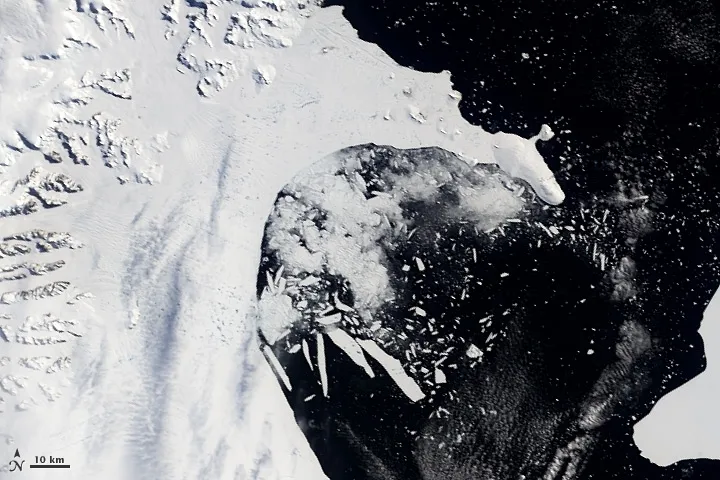
They didn’t know it then, but Domack and his expedition colleagues would be some of the last people to see the ice sheet intact in person. By the time they got home to the U.S. about two months later, the ice shelf had nearly completely disintegrated. A plateau of ice measuring 1,250 square miles — an area bigger than Rhode Island — had just collapsed into pieces, shattering like the safety glass of a car’s windshield.
Detailed satellite images, which weren’t available when the Larsen A failed, “vividly helped show anybody who looked at it how large and catastrophic an event this was,” said Ted Scambos, a glaciologist at the National Snow & Ice Data Center in Boulder, Colo.
Get the world’s most fascinating discoveries delivered straight to your inbox.
The event “was sort of a wake-up call for a lot of earth scientists,” Domack said. It showed the sudden and acute changes that global warming could induce, and how important ice shelves were to glacial systems, acting like doorstops to hold back the glaciers that fed into them and that could significantly raise global sea level. Once the Larsen B ice shelf was gone, the glaciers behind it drastically sped up, running into the sea up to six times as fast as they had previously.
In a new study, detailed in the Sept. 12 issue of the journal Science, Domack and his colleagues used data from a 2006 expedition to the Larsen B area to bolster their idea that the warm air that gripped the Antarctic Peninsula over those summers in the early 2000s and caused so much surface melt was what set off the Larsen B’s disintegration. This and other efforts to understand the causes of the collapse of the ice shelves could help scientists better know what to look for in their studies in the field and to better represent glacier melt and retreat in climate models.
Prevailing Paradigm
A number of theories have been put forward to describe why the Larsen B and other ice shelves collapse.
The prevailing one in 2002 was that ice shelf-glacier systems were destabilized by warm ocean waters eating away at them from below, Domack said. The ocean waters melt the ice shelf from underneath, thinning it and making it more vulnerable to cracking. Other scientists thought that thinning from below had combined with the meltwater above to completely destabilize the Larsen B.
However, Domack and Scambos were part of a group of scientists who immediately after the event suspected that the series of warm summers and the pooling meltwater were almost entirely to blame for the collapse.
Typically in the summer months, some of the fresh winter snow atop the ice shelf melts. Below the fresh snow is a layer of firn, or snow from earlier seasons that has been partially compacted, but is still permeable “like the ice of a snow cone,” Domack explained. And like the flavored syrups that permeate a snow cone, the meltwater at the ice shelf’s surface percolates through the snow and firn and eventually refreezes into a thin layer of ice.
But when an ice shelf reaches the state that the Larsen B was at during the summer of 2001-02, with a thick layer of ice at its top, the meltwater has nowhere to go but to pool up or to infiltrate cracks. The pools absorb more sunlight than the snow around them and drive further melt, while the water in cracks can widen them and eventually bust them open. The growth of melt ponds on the Larsen B shelf were clearly visible in the satellite images, but “the scientific community wasn’t willing to accept that as the sole contributor,” Domack said.
New research released earlier this year pointed to other parts of Antarctica where warm ocean waters were gnawing away at ice shelves, causing the area where glaciers meet ice shelves to retreat, gradually weakening the whole system and setting it up for “unstoppable” melt.
Those findings “made some of us take a second look at the Larsen B,” Scambos said, to see if that could have been the ultimate trigger for the breakup after the pooling meltwater set the stage.
Rare Opportunity
The collapse of the Larsen B, while an ominous sign for Antarctica’s integrity and for future sea level rise, created a rare scientific opportunity. Largely open water now stood where the ice shelf had once been, meaning scientists could sample sediment from the newly-accessible seafloor to learn about the evolution of the ice shelf.
In 2006, Domack and a team of researchers arrived at the Larsen B’s former location in only a lightweight icebreaker ship — “that’s how warm and ice-free it was there,” Scambos said — and took samples of the ocean bed. They also mapped the bumps and dips of the seafloor.
The team found the spot where the glacial ice started floating on the ocean some 12,000 years ago, at the end of the last ice age. They could also tell that the site hadn’t had open water above it since that time, which means that the ice shelf had been in place for at least that long.
That long-term stability indicates that undercutting from below wasn’t the major driver of the Larsen B’s collapse, Domack and Scambos said.
“It does look like there was some level of ocean influence on weakening the Larsen B, but just a little bit and back in the 70s and 80s,” Scambos said. "The core reason for the breakup has to do with air temperature warming.”
Glaciologist Eric Rignot, who studied the role of undercutting in the research published earlier this year, said of the new study that, “overall, it is a fine piece of analysis but the major conclusions are not all that surprising,” given other work from the same scientists that has come to much the same conclusion. Rignot, who has joint appointments at NASA’s Jet Propulsion Laboratory and the University of California, Irvine, and was not involved with this study, is also less convinced that there wasn’t a mix of factors that caused the Larsen B to collapse.
“Surface melting was certainly a key factor, no doubt about that,” he said. But he thinks that melting from below also played more of a role than do Domack or Scambos.

Whole Picture
That the warming air was ultimately the cause of the Larsen B’s collapse, or at least a significant factor, makes sense given its location on the rapidly warming Antarctic Peninsula. Temperatures have risen 4.5°F in that area since 1950, more than 3.5°F above the global average for that period.
If the combination of surface melt and undercutting by warm ocean waters happened in the right (or wrong, as it may be) area of Antarctica, “we could have some real interesting situations,” in terms of sea level rise potential, Scambos said.
The glaciers that Antarctic scientists are most worried about at the moment are the one’s from Rignot’s study, the Pine Island Glacier and Thwaites Glacier, which are linchpins to a large section of the West Antarctic Ice Sheet. That ice sheet alone has the potential to raise sea levels by 10-13 feet if it were all to melt. Rignot and his colleagues think they have found the spot from which the grounding line — the spot where glacier turns into ice shelf — recently retreated thanks to melting from below, though Domack said that sampling would be needed to tell more definitively.
But Domack said recent research shows that the warming that is so pronounced on the Antarctic Peninsula is more widespread than previously thought.
“So the surface phenomenon might have a broader reach” than undermelt in the future, though not at present, he said.
All of this research taken together has shown that these two processes are key ones to understand for proper climate modeling and to hone in on in future studies in Antarctica and Greenland, which is also covered by a large ice sheet with the potential to drastically raise global sea level.
There’s also still much to learn about the story of the Larsen B, including its earlier history before the last ice age as well as monitoring the tiny remnant that remained after the collapse. There is also the massive Larsen C ice shelf, which sits just to the south of where the Larsen A and B once stood and could be the next to collapse.
“The story’s not completely over,” Scambos said.
For his part, Domack is still clearly still impressed by the fragile sight of the Larsen B more than a decade later.
“I think just the rapidity of the change is mind-boggling. One day it's there and the next day it’s gone,” Domack said. “Those things can sneak up on you if you’re not watching.”
You May Also Like: See How This Summer's Temperatures Stack Up ‘Urgency of Climate Change’ to Debut as Legal Defense Coal Plants Lock in 300 Billion Tons of CO2 Emissions A Tale of Two Cities: Miami, New York and Life on the Edge
Follow the author on Twitter @AndreaTWeather or @ClimateCentral. We're also on Facebook & other social networks. Original article on Climate Central.

Andrea Thompson is an associate editor at Scientific American, where she covers sustainability, energy and the environment. Prior to that, she was a senior writer covering climate science at Climate Central and a reporter and editor at Live Science, where she primarily covered Earth science and the environment. She holds a graduate degree in science health and environmental reporting from New York University, as well as a bachelor of science and and masters of science in atmospheric chemistry from the Georgia Institute of Technology.