


Vanishing Forests: New Map Details Global Deforestation
A new global map of deforestation reveals that 888,000 square miles (2.3 million square kilometers) of forest has vanished since 2000.
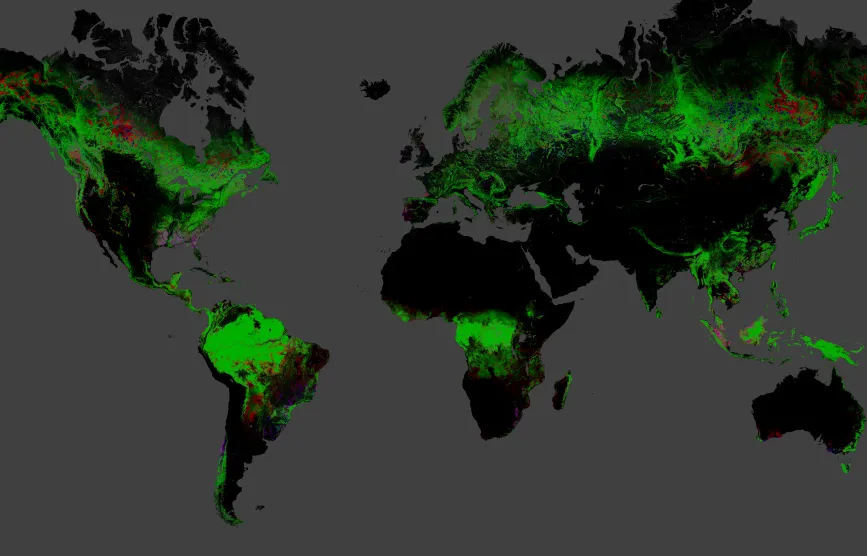
The interactive map (viewable online) is based on satellite data and is the first of its kind. The calculations are accurate down to about 100 feet (30 meters), enough detail to provide useful local information while still covering the whole globe.
"We say that it's globally consistent but locally relevant," said Matt Hansen, a geographer at the University of Maryland who led the mapping effort. "We can describe a global dynamic and compare regions as apples to apples, but if you cut out any particular corner, it would be accurate and have meaning."
Mapping deforestation
The map covers the time frame from 2000 to 2012, and includes both forest losses and forest gains. During that time, 309,000 square miles (800,000 square km) of new forests were gained. Of the 888,000 square miles lost and 309,000 square miles gained, about 77,000 square miles (200,000 square km) were areas that were lost between 2000 and 2012 and then re-established.
The rest of the loss and gain occurs in tandem all over the globe. For example, Brazil's efforts to slow deforestation have paid off, with about 500 square miles (1,300 square km) less loss each year. But the rest of the tropics more than made up for Brazil's improvements with rapidly increasing losses.

Indonesia saw the fastest increases in deforestation. Before 2003, the country lost less than 4,000 square miles (10,000 square km) per year. By 2011, more than 7,700 square miles (20,000 square km) of Indonesian forests vanished each year, Hansen and his colleagues report in the Nov. 15 issue of the journal Science.
Get the world’s most fascinating discoveries delivered straight to your inbox.
Humans are the main driver of deforestation, through logging and clear-cutting, Hansen told LiveScience. Forest fires come next, mostly in the boreal forests of temperate regions. Storm damage also harms forests. [7 Ways the Earth Changes in the Blink of an Eye]
"We see a lot of blowdowns and that kind of thing," Hansen said.
Incredible detail
The broad-scale yet fine-grained map was made possible by three technology windfalls, Hansen said. The first was data from the Landsat 7 satellite, which launched in 1999 and has been snapping satellite photos of the globe ever since.
Next, Landsat's operator, the U.S. Geological Survey, altered its policies to make all of the data from Landsat 7 and previous Landsat satellites free. Previously, Hansen said, researchers had to buy the data piecemeal. It would have cost millions to purchase the data for the entire globe.
"We never had the data we needed," he said. "We had the data we could afford."
Finally, with access to all the satellite data came the need for major computing power to process it. Hansen and his colleagues teamed up with Google to make it happen. On a single computer, processing the data archive would have taken 15 years, Hansen said. With Google's cloud computing, it took mere days.
The fine scale of the map allows researchers to zoom in close enough to see logging roads, river meanders and even tornado tracks, Hansen said.
"There are a ton of stories here," he said. Some of the information that comes from forest maps is entirely unexpected, he added. One researcher took another of Hansen's maps and found that tree cover correlates with human health, because forest dwellers eat a more diverse diet than people in other environments do.

In the North American West, damage from fire, logging and infection by the devastating mountain pine beetle is evident. A windstorm in 2009 shows up as leveled trees in southwestern France. In southern Sweden, an extratropical cyclone flattened forests in 2005.
Still, 32 percent of global loss occurred in the tropics, with half of that amount attributable to South American countries, the researchers found.
The data reveal that some areas that are supposedly protected really aren't, Hansen said. Clear-cutting appears even inside national-park boundaries in some countries.
Now, the team is working to map primary forest — native habitat that is crucial for biodiversity and storing climate-warming carbon — and differentiate it from secondary forests, which may provide tree cover but without the original ecosystems. The team also plans to continue to update the map annually, and hopes to be able to raise the deforestation alarm even more frequently in the future.
"We want to get in real-time mode," Hansen said.
Follow Stephanie Pappas on Twitter and Google+. Follow us @livescience, Facebook & Google+. Original article on LiveScience.

Stephanie Pappas is a contributing writer for Live Science, covering topics ranging from geoscience to archaeology to the human brain and behavior. She was previously a senior writer for Live Science but is now a freelancer based in Denver, Colorado, and regularly contributes to Scientific American and The Monitor, the monthly magazine of the American Psychological Association. Stephanie received a bachelor's degree in psychology from the University of South Carolina and a graduate certificate in science communication from the University of California, Santa Cruz.