
 Live Science Plus


Hurricane Sandy: Photos of a Frankenstorm

Ghostly Silhouette

The Bride of Frankenstorm Hits

TRMM rainfall totals were tallied for the seven-day period from Oct. 18-25, 2012.The heaviest rainfall occurred over open ocean where totals were as high as 325 millimeters. Rainfall amounts as high as 250 millimeters were measured over eastern Cuba and some extreme southern areas of Hispaniola. Hurricane Sandy's track with appropriate symbols is shown overlaid in white.
Unavoidable Collision
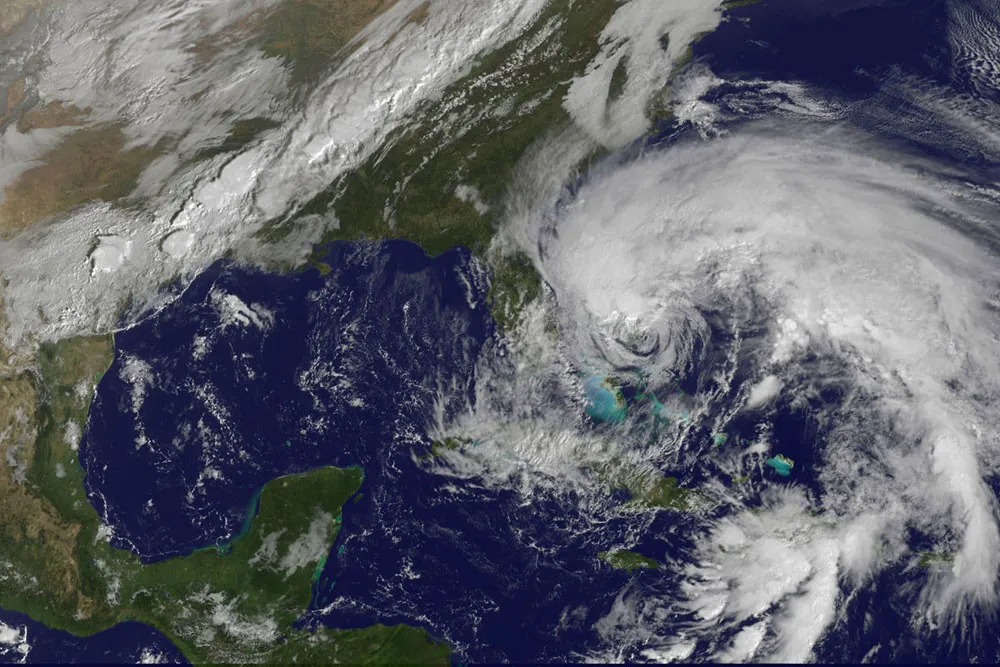
This visible image was taken from NOAA's GOES-13 satellite on Friday, Oct. 26 at 1415 UTC (10:15 a.m. EDT) and shows Hurricane Sandy's huge cloud extent of up to 2,000 miles while centered over the Bahamas, and the line of clouds associated with a powerful cold front approaching the U.S. east coast.

U.S. East Coast Threatened

On Oct. 25 at 1425 UTC (10:25 a.m. EDT), NASA's TRMM satellite saw that rain associated with Hurricane Sandy storm's center, was moderate (in green and blue) and falling at a rate of 20 to 40 mm per hour. The heaviest rainfall at the time of this image was falling over the Dominican Republic at more than 2 inches/50 mm per hour (red).
Gut-wrenching beauty

This still from a NASA video shows a view of Hurricane Sandy on Thursday, Oct. 25, as the Category 2 storm approached the Bahamas. The video was taken by cameras aboard the International Space Station 240 miles above Earth.
Monster Storm

When NASA's Terra satellite flew over Hurricane Sandy around noon local time on Oct. 25, it captured a visible image of Hurricane Sandy that showed the large extent of the storm. Sandy has grown since the morning hours on Oct. 25 by about 120 miles in diameter according to satellite data.
The MODIS image revealed strong thunderstorms in its southern arm, positioned over the Dominican Republic and Haiti, and eastern Puerto Rico. The center of the storm was moving through the Bahamas, and the northwestern edge had already spread clouds over southern Florida.
At 11 a.m., tropical-storm-force winds extended up to 140 miles (220 km) from the center, making Sandy more than 280 miles in diameter. By 2 p.m., just over three hours later, Sandy had grown. Sandy's tropical storm-force-winds now extend outward up to 205 miles (335 km) from the center, making the storm about 410 miles in diameter!
The Storm Intensifies
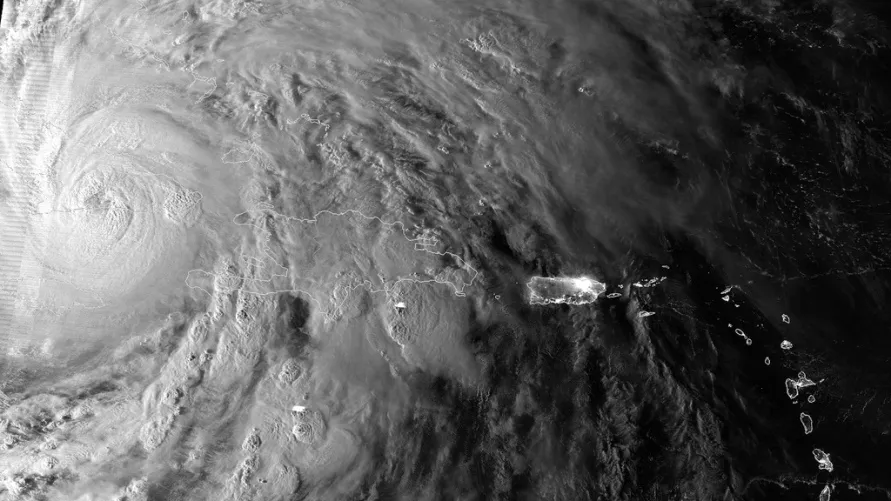
Early in the morning on October 25, 2012, the Suomi NPP satellite passed over Hurricane Sandy after it made landfall over Cuba and Jamaica, capturing this highly detailed infrared imagery, showing areas of deep convection around the central eye. Besides the highly detailed infrared imagery, the satellite’s day night band captured detailed visible-like imagery of the cloud tops, along with the city lights of Puerto Rico and the Virgin Islands.
From the ISS

A camera aboard the International Space Station captured this view of Hurricane Sandy on Oct. 26, 2012.
A Giant Storm

Another view from the International Space Station of Hurricane Sandy on Oct. 26.
Frankenstorm

The U.S. National Weather Service dubbed Sandy a potential "Frankenstorm" on Thursday, Oct. 25, due to the chance it will merge with a cold front and transform into a hybrid storm next week, just before Halloween. (Shown here in an Oct. 26 image taken by cameras aboard the International Space Station.)
Barrels the Bahamas

A still from a NASA animation of satellite observations of Hurricane Sandy as it crosses eastern Cuba and moves through the Bahamas. This visualization was created by the NASA GOES Project at NASA Goddard Space Flight Center, Greenbelt, Md., using observations from NOAA's GOES-13 satellite, captured from Oct. 24-26.
