
-
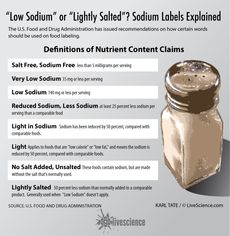 Salt Labeling Explained (Infographic)
USDA recommendations for salt labeling on food packaging.
health -
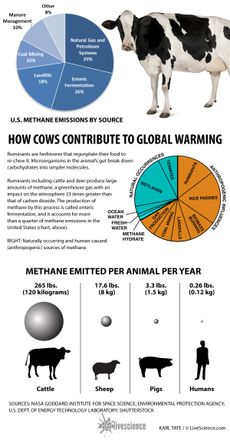 The Role of Animal Farts in Global Warming (Infographic)
Methane gas fermented in the guts of farm animals contribute up to 26 percent of U.S. methane emissions.
climate-change -
 How the Time Traveling 'Back to the Future' DeLorean Works (Infographic)
Doc Brown's time machine is a nuclear powered, stainless-steel flying car.
technology -
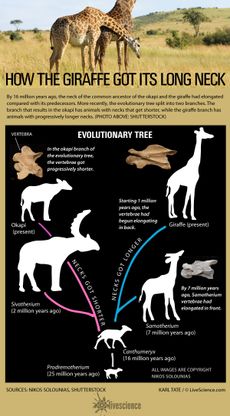 Here's How the Giraffe Got Its Long Neck (Infographic)
An ancestor of the giraffe split into two evolutionary branches, one leading to the okapi with its short neck and the other branch leading to the giraffes.
land-mammals -
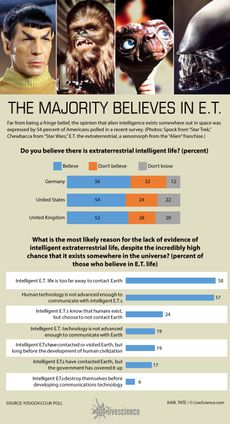 Who Believes in Aliens? (Infographic)
A poll recently showed that greater than one in two persons polled believes that intelligent extraterrestrial life lurks somewhere in the cosmos.
extraterrestrial-life -
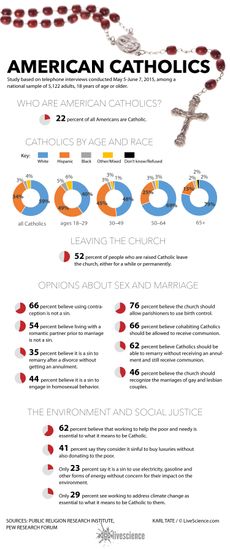 Survey of the Attitudes of American Catholics (Infographic)
Ahead of the Pope's visit to America, the Pew Research Forum interviewed 5,122 Catholics about their views on various topics.
human-behavior -
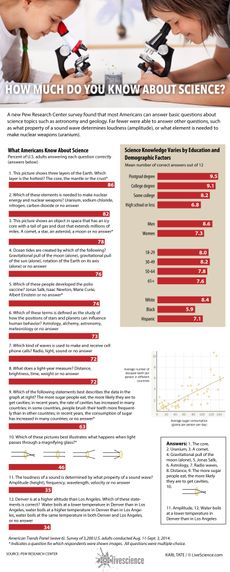 Testing the Scientific Knowledge of Americans (Infographic)
A Pew survey tried to determine the level of scientific knowledge of the average American.
human-behavior -
 The Alaskan Arctic Oil Drilling Controversy Explained (Infographic)
Oil companies plan to extract billions of barrels of crude oil from beneath Alaskan lands and Arctic seas that are at risk for environmental damage.
fossil-fuels -
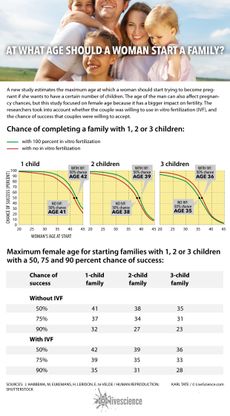 How Long Can You Really Wait to Have Kids? Here’s a Graph (INFOGRAPHIC)
A new study estimates the maximum age that couples should start trying to become pregnant if they want a certain number of children.
reproductive-health


