Natural fluctuations alone do not explain warming in the upper layers of the planet's oceans, confirms a new computer modeling study.
The ingredient necessary to fully account for rising water temperatures in the last 50 years? Humans' greenhouse gas emissions.
While attributing global warming to humans is hardly a new conclusion, this study adds to research intended to tease apart the effects of natural climate cycles, which can occur over decades, from changes caused by human alterations to the environment.
Latest Videos FromLive Science
"The bottom line is that this study substantially strengthens the conclusion that most of the observed global ocean warming over the past 50 years is attributable to human activities," climate scientist Peter Gleckler, of the Lawrence Livermore National Laboratory, said in a statement.
Measurements show that, between the surface and a depth of 2,300 feet (700 meters), the global oceans have warmed on average 0.045 degrees Fahrenheit (0.025 degrees Celsius) per decade over 50 years. This is much less than atmospheric warming because water is much slower to absorb heat. The oceans can also store heat much more effectively.
In this study, researchers combined improved observational estimates of actual ocean warming with model simulations that use mathematical equations to simulate a variety of scenarios.
The team led by Gleckler compared climate simulations that included the effects of human greenhouse gas emissions with those that did not. The latter scenarios essentially left humans out of the climate change equation to see how warming might progress without them.
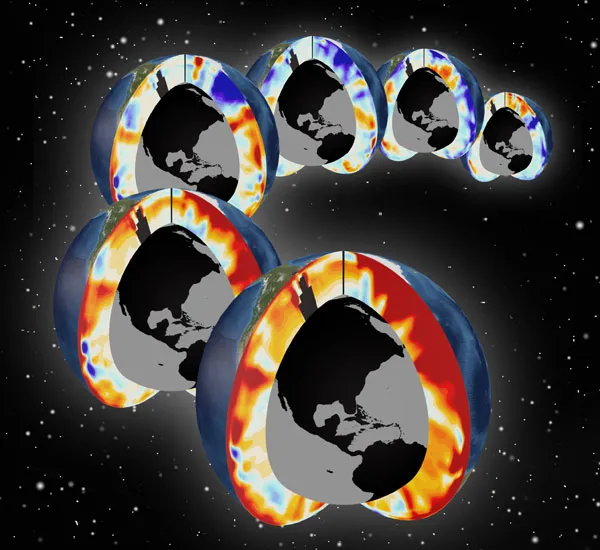
"Although we performed a series of tests to account for the impact of various uncertainties, we found no evidence that simultaneous warming of the upper layers of all seven seas can be explained by natural climate variability alone. Humans have played a dominant role," Gleckler said in a statement.
The study is detailed in yesterday's (June 10) issue of the journal Nature Climate Change.
Follow LiveScience writer Wynne Parry on Twitter @Wynne_ParryorLiveScience @livescience . We're also on Facebook & Google+.