What Are the Odds? Temperature Records Keep Falling (Op-Ed)
Get the world’s most fascinating discoveries delivered straight to your inbox.
You are now subscribed
Your newsletter sign-up was successful
Want to add more newsletters?

Delivered Daily
Daily Newsletter
Sign up for the latest discoveries, groundbreaking research and fascinating breakthroughs that impact you and the wider world direct to your inbox.

Once a week
Life's Little Mysteries
Feed your curiosity with an exclusive mystery every week, solved with science and delivered direct to your inbox before it's seen anywhere else.

Once a week
How It Works
Sign up to our free science & technology newsletter for your weekly fix of fascinating articles, quick quizzes, amazing images, and more
Delivered daily
Space.com Newsletter
Breaking space news, the latest updates on rocket launches, skywatching events and more!

Once a month
Watch This Space
Sign up to our monthly entertainment newsletter to keep up with all our coverage of the latest sci-fi and space movies, tv shows, games and books.

Once a week
Night Sky This Week
Discover this week's must-see night sky events, moon phases, and stunning astrophotos. Sign up for our skywatching newsletter and explore the universe with us!
Join the club
Get full access to premium articles, exclusive features and a growing list of member rewards.
Michael Mann is a distinguished professor of meteorology at Pennsylvania State University and author of "The Hockey Stick and the Climate Wars: Dispatches from the Front Lines" (Columbia, 2013) and the recently updated and expanded "Dire Predictions: Understanding Climate Change" (DK, 2015). Mann contributed this article to Live Science's Expert Voices: Op-Ed & Insights.
With the official numbers now in 2015 is, by a substantial margin, the new record-holder, the warmest year in recorded history for both the globe and the Northern Hemisphere. The title was sadly short-lived for previous record-holder 2014. And 2016 could be yet warmer if the current global warmth persists through the year.
One might wonder: Just how likely is it to see such streaks of record-breaking temperatures if not for human-caused warming of the planet?
Playing the odds?
A year ago, several media organizations posed precisely that question to various climate experts in the wake of then-record 2014 temperatures. Specifically, they asked about the fact that nine of the 10 warmest and 13 of the 15 warmest years have occurred since 2000. The different press accounts reported odds ranging anywhere from one in 27 million to one in 650 million that the observed run of global temperature records might have resulted from chance alone, i.e., without any assistance from human-caused global warming .
My colleagues and I suspected the odds quoted were way too slim. The problem is that the computations had treated each year as though it were statistically independent of neighboring years (i.e., that each year is uncorrelated with the year before it or after it), but that's just not true. Temperatures don't vary erratically from one year to the next. Natural variations in temperature wax and wane over a period of several years. The factors governing one year's temperature also influence the next.
For example, the world has recently seen a couple very warm years in a row due, in part, to El Niño-ish conditions that have persisted since late 2013, and it is likely that the current El Niño event will boost 2016 temperatures, as well. That's an example of an internally generated natural variation; it just happens on its own, much as weather variations from one day to the next don't require any external driver. They just happen on their own.
Get the world’s most fascinating discoveries delivered straight to your inbox.
There are also natural temperature variations that are externally caused, or "forced", e.g. the multiyear cooling impact of large, explosive volcanic eruptions (think the 1991 Mt. Pinatubo eruption, or the small, but measurable changes in solar output that occur on timescales of a decade or longer).
Each of those natural sources of temperature variation helps ensure that temperatures correlate from one year to the next, and each would be present even in the absence of global warming. These correlations between neighboring years are critical for reliable climate statistics.
A smaller data pool
Statistics can help solve that problem. Statisticians refer to the problem posed by the correlations between neighboring data points as "serial correlation" or "autocorrelation," defined as the correlation between a series of data values and a copy of that series shifted by one, two, three or more. If those correlations remain high, even for large shifts, then there is more serial correlation.
The serial correlation in the climate data shrinks the effective size of the temperature data set — it's considerably smaller than one would estimate based purely on the number of years available.
There are 136 years of annual global temperature data from 1880 to 2015. However, when accounting for the natural correlations between neighboring years, the effective size of the sample is a considerably smaller number: roughly 30 independent temperature values out of a total of 136 years.
Warm and cold periods thus tend to occur in stretches of roughly four years. And runs of several cold or warm years are far more likely to happen based on chance alone than one would estimate under the incorrect assumption that natural temperature fluctuations are independent of each other from one year to the next.
Better model, clearer outcomes
One can account for such effects by using a more sophisticated statistical model that faithfully reproduces the characteristics of natural climate variability. My co-authors and I used such an approach to more rigorously determine how unusual the recent runs of record-breaking temperatures actually are. We have now reported our findings in an article just published in the Nature journal Scientific Reports. With the study having come out shortly after New Year's Day, we are able to update the results from the study to include the new, record-setting 2015 temperature data.
Our approach combines information from the state-of-the-art climate model simulations used in the most recent report of the Intergovernmental Panel on Climate Change (IPCC) with historical observations of average temperatures for the globe and Northern Hemisphere. Averaging over the various model simulations provides an estimate of the "forced" component of temperature change, which is the component driven by factors that are external, natural (i.e. volcanic and solar) and human-caused (emission of greenhouse gas and pollutants).
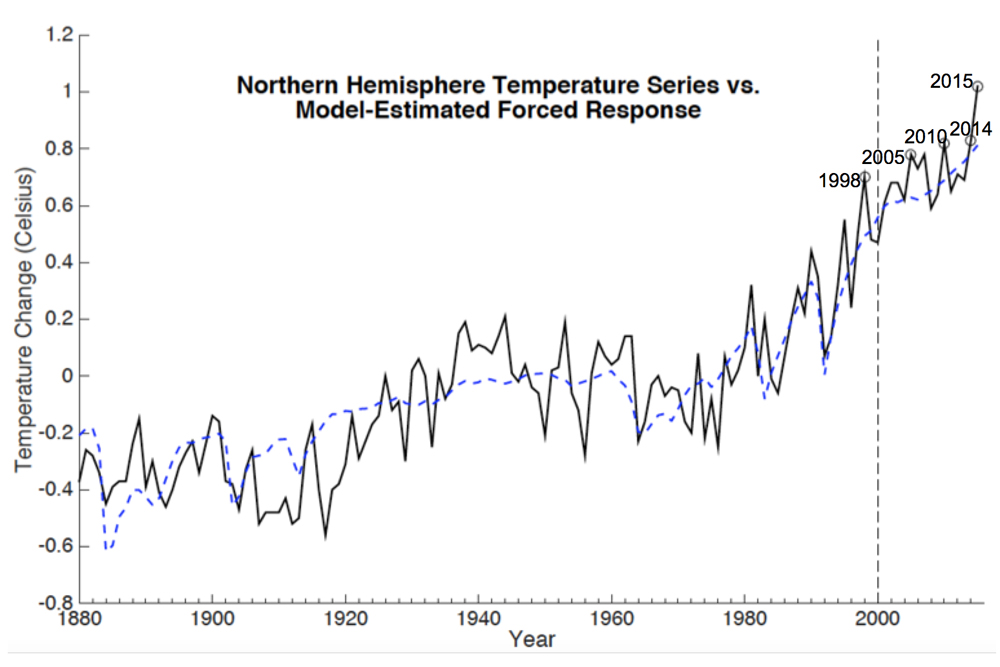
We focused on the Northern Hemisphere temperature record because it is considerably better-sampled, particularly in earlier years, than the global mean temperature. When the actual Northern Hemisphere data series is compared to the model-estimated "forced" component of temperature change alone (see Fig. 1), the difference between the two series provides an estimate of the purely unforced, internal component of climate variability. (That's, for example, the component associated with internal fluctuations in temperature such as those linked to El Niño.) It is that component that can be considered random, and which we represent using a statistical model.
Using our model, we generated a million alternative versions of the original series, called "surrogates." Each had the same basic statistical properties as the original series, but differed in the historical details, such as the magnitude and sequence of individual, annual temperature values. Adding the forced component of natural temperature change (due to volcanic and solar impacts) to each of these surrogates yields an ensemble of a million surrogates for the total natural component of temperature variation.
These surrogates represent alternative Earth histories in which there was no human impact on the climate. In these surrogates, the basic natural properties of the climate are the same, but the random internal component of climate variability simply happens to have followed a different path. By producing enough of these alternative histories, we can determine how often various phenomena are likely to have happened by chance alone.
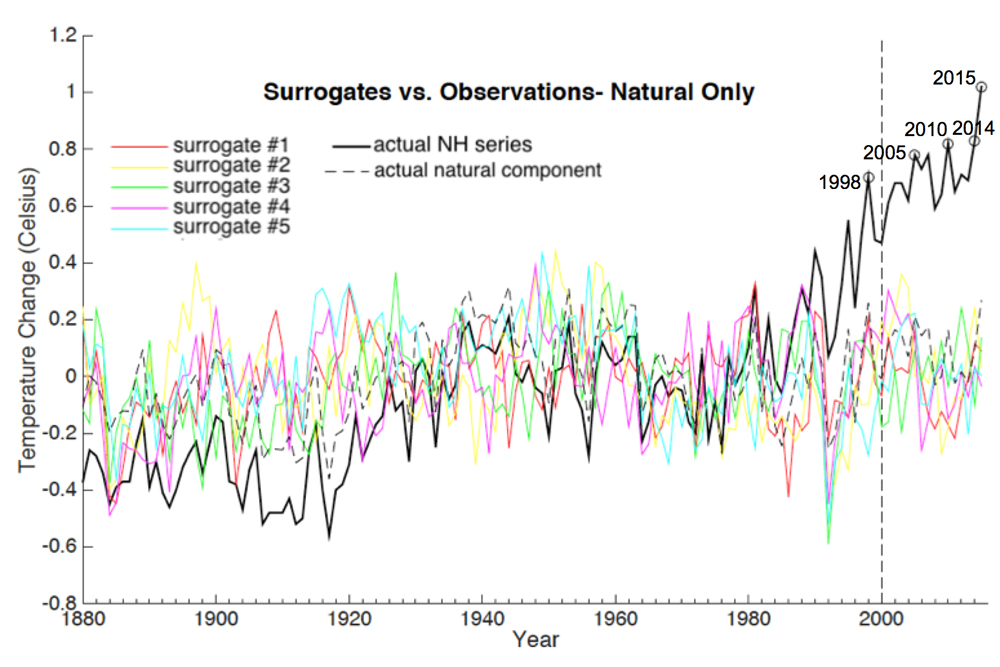
These surrogates reveal much when compared (Fig. 2) with the estimated natural component of temperature and the full temperature record.Tabulating results from the surrogates, we are able to diagnose how often a given run of record temperatures is likely to have arisen naturally. Our just-published study, having been completed prior to 2015, analyzed the data available through 2014, assessing the likelihood of 9 of the warmest 10 and 13 of the warmest 15 years having each occurred since 2000.
While the precise results depend on various details of the analysis, for the most defensible of assumptions, our analysis suggests that the odds are no greater than one in 170,000 that 13 of the 15 warmest years would have occurred since 2000 for the Northern Hemisphere average temperature, and one in 10,000 for the global average temperature.
Even when we vary those assumptions the odds never exceed one in 5,000 and one in 1,700, respectively. Changes to the assumptions include using different versions of the observational temperature data sets that deal differently with gaps in the data, or using different algorithms for randomizing the data to produce surrogates. While not nearly as unlikely as past press reports might have suggested, the observed runs of record temperatures are nonetheless extremely unlikely to have occurred in the absence of global warming.
Updating the analysis to include 2015, we find that the record temperature run is even less likely to have arisen from natural variability. For the Northern Hemisphere, the odds are no greater than one in 300,000 that 14 of the 16 warmest years over the 136-year period would have occurred since 2000.
The odds of back-to-back records (something we haven't seen in several decades) as witnessed in 2014 and 2015, is roughly one in 1,500.
We can also use the surrogates to assess the likelihoods of individual annual temperature records, such as those for 1998, 2005, 2010, 2014 and now 2015, when temperatures were not only warmer than in previous years, but actually reached a particular threshold of warmth. This is even less likely to happen in the absence of global warming: The natural temperature series, as estimated in our analysis (see Fig. 2), almost never exceeds a maximum value of 0.4 degrees Celsius (0.7 degrees Fahrenheit) relative to the long-term average, while the warmest actual year, 2015, exceeds 1 degree C (1.8 degrees F). For none of the record-setting years — 1998, 2005, 2010, 2014 or 2015 — do the odds exceed one in a million for temperatures having reached the levels they did due to chance alone, for either the Northern Hemisphere or global mean temperature.
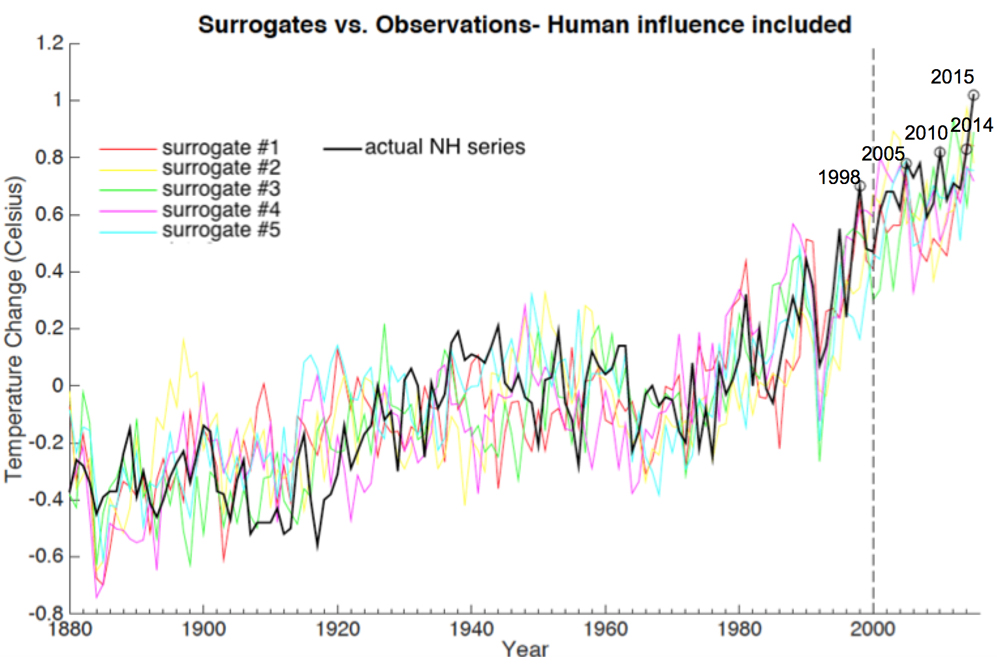
Finally, by adding the human-forced component to the surrogates, we are able to assess the likelihood of the various temperature records and warm streaks when accounting for the effects of global warming (see Fig. 3).
Using data through 2014, we estimate a 76 percent likelihood that 13 of the warmest 15 years would occur since 2000 for the Northern Hemisphere. Updating the analysis to include 2015, we find there is a 76 percent likelihood that 14 of the 16 years would occur since 2000, as well. The likelihood of back-to-back records during the two most recent years, 2014 and 2015, is just over 8 percent, still a bit of a fluke, but hardly out of the question.
As for individual record years, we find that the 1998, 2005, 2010, 2014 and 2015 records had likelihoods of 7 percent, 18 percent, 23 percent, 40 percent and 7 percent, respectively. So while the 2014 temperature record had nearly even odds of occurring, the 2015 record had relatively long odds.
There is good reason for that. The 2015 temperature didn't just beat the previous record, but smashed it, coming in nearly 0.2 degrees C (0.4 degrees F) warmer than 2014. The 2015 warmth was boosted by an unusually large El Niño event, indeed, by some measures, the largest on record. A similar story holds for 1998, which prior to 2015 was itself the largest El Niño on record. This El Niño similarly boosted 1998's warmth, which beat the previous record (1995), again by a whopping 0.2 C. That might sound small, but given that the past several records have involved differences of a few hundredths of a degree C — winning by a nose — 0.2 C is winning by a distance. Each of the two monster El Niño events was, in a statistical sense, somewhat of a fluke. And each of them imparted considerably greater large-scale warmth than would have been expected from global warming alone. [Watch Earth Get Hotter - 135 Years Of Temperature Changes Visualized ]
That analysis, however, neglects one intriguing possibility. Could it be that human-caused climate change is actually boosting the magnitude of El Niño events themselves, leading to more monster events like those in 1998 and 2015? That proposition indeed finds some support in the recent peer-reviewed literature, including a 2014 study in the journal Nature Climate Change. If the hypothesis turns out to be true, then the record warmth of 1998 and 2015 might not have been flukes after all.
Simply stated, we find that the various record temperatures and runs of unusually warm years since 2000 are extremely unlikely to have happened in the absence of human-caused climate change, but reasonably likely to have happened when we account for climate change. We can, in this sense, attribute the record warmth to human-caused climate change at a high level of confidence.
What about the talking point often still heard in some quarters that "global warming has stopped"? Will the record recent warmth put an end to the claim? Was there any truth to the claim in the first place? There was, in fact, a temporary slowdown in surface warming during the period 2000 to 2012, and there is an interesting and worthy ongoing debate within the climate research community about precisely what role both external and internal factors might have played in that slowdown. It is clear, however, that despite the decadal fluctuations in rate, the long-term warming of the climate system continues unabated. The recent record warmth simply underscores that fact
So the next time you hear someone call into question the reality of human-caused climate change, you might explain to them that the likelihood of witnessing the recent record warmth in the absence of human-caused climate change is somewhere between one in a thousand and one in a million. You might ask them: Would you really gamble away the future of the planet with those sorts of odds?
Follow all of the Expert Voices issues and debates — and become part of the discussion — on Facebook, Twitter and Google+. The views expressed are those of the author and do not necessarily reflect the views of the publisher. This version of the article was originally published on Live Science .

Michael E. Mann is presidential distinguished professor and director of the Center for Science, Sustainability and the Media at the University of Pennsylvania. He is author of the new book "Our Fragile Moment: How Lessons from Earth's Past Can Help Us Survive the Climate Crisis." (PublicAffairs, 2023) and "The New Climate War: The Fight to Take Back Our Planet" (PublicAffairs, 2021).
 Live Science Plus


