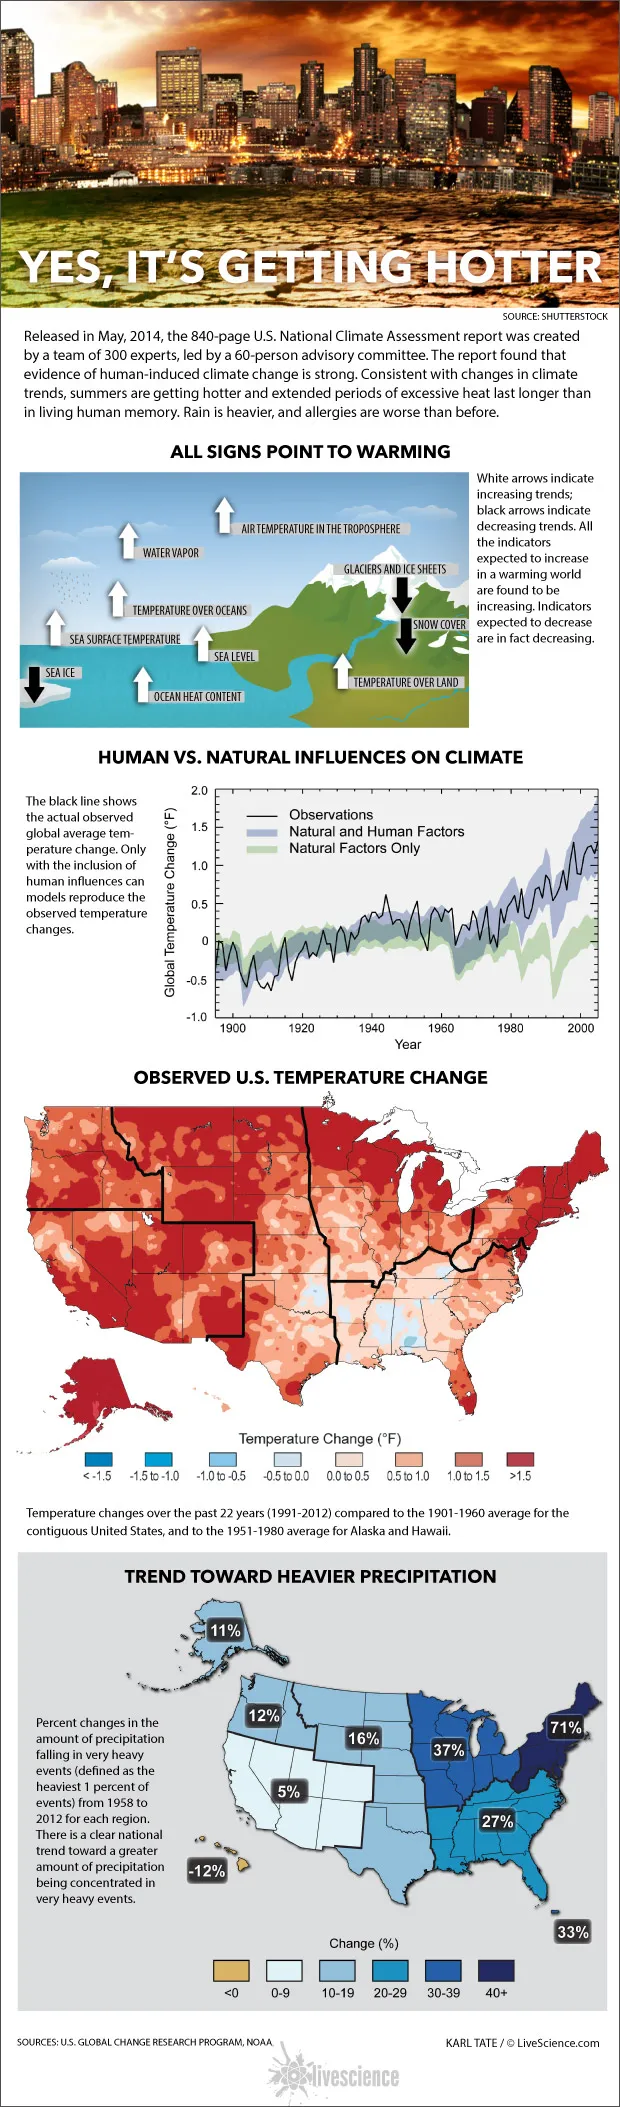
Released in May, 2014, the 840-page U.S. National Climate Assessment report was created by a team of 300 experts, led by a 60-person advisory committee. The report found that evidence of human-induced climate change is strong. Consistent with changes in climate trends, summers are getting hotter and extended periods of excessive heat last longer than in living human memory. Rain is heavier, and allergies are worse than before.
All the indicators expected to increase in a warming world are found to be increasing. Indicators expected to decrease are in fact decreasing. Only with the inclusion of human influences can models reproduce the observed temperature changes.
Percent changes in the amount of precipitation falling in very heavy events (defined as the heaviest 1 percent of events) from 1958 to 2012 show a clear national trend toward a greater amount of precipitation being concentrated in very heavy events.
Article continues below
Sign up for the Live Science daily newsletter now
Get the world’s most fascinating discoveries delivered straight to your inbox.
Karl has been Purch's infographics specialist across all editorial properties since 2010. Before joining Purch, Karl spent 11 years at the New York headquarters of The Associated Press, creating news graphics for use around the world in newspapers and on the web. He has a degree in graphic design from Louisiana State University.