People living on the coast are often the first concern when a hurricane strikes. But it's actually the folks farther inland that typically see the most fatalities, due to intense rains causing flash floods and mudslides, as well as tornadoes spawned by tropical cyclones.
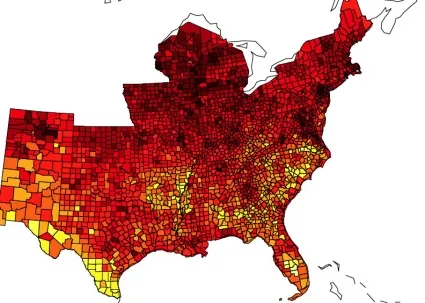
More than 60 percent of hurricane-related deaths occur inland and away from the ocean, according to a statement from the University Corporation for Atmospheric Research, based in Boulder, Colo. To help reduce the number of these inland deaths, researchers have created a map to show what areas in the United States are most vulnerable. They created it after examining census data, socio-economic factors, local geography and historical records of hurricane impacts.
Hurricane Floyd in 1999, for example, produced intense winds 1,300 miles (2,100 kilometers) inland. Hurricane Isaac looks likely to produce heavy rains as far north as central Indiana.
Latest Videos From
The map weighs such socio-economic factors as income level, age and local emergency preparedness.
Poor areas may not be able to deal well with an emergency, for example, if people don't have cars or the resources to quickly vacate their homes, said James Done, a UCAR researcher involved in making the map. Both the elderly and very young are also more vulnerable. These groups were among the most affected by Hurricane Katrina, as they were the least able to evacuate the city after the mandatory order came the day before the monster storm struck.
One of the most vulnerable states, according to the analysis, is Arkansas. That's primarily because the state isn't well-equipped to respond to disasters or to communicate to its citizens what they should do in case of an emergency, Done said. Isaac's projected path is likely to take it over Arkansas, where it could dump substantial amounts of rain.
Another strange result is that areas with more men may be more vulnerable; for unclear reasons, 71 percent of hurricane-related flooding victims are male, according to the release.
The map was made in nine weeks, said Done, primarily by Purdue University graduate student Dereka Carroll. It's an ongoing project and hasn't yet been published in a peer-reviewed journal.
Although the map isn't currently being used by emergency managers, Done said he thinks it could help guide decision-making in the future to save lives.
To see where you stand in terms of vulnerability to hurricanes, check out the map here.
Reach Douglas Main at dmain@techmedianetwork.com. Follow him on Twitter @Douglas_Main. Follow OurAmazingPlanet on Twitter @OAPlanet. We're also on Facebook and Google+.

 Live Science Plus