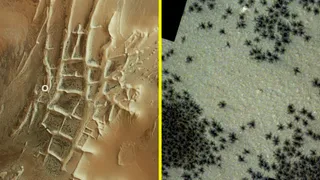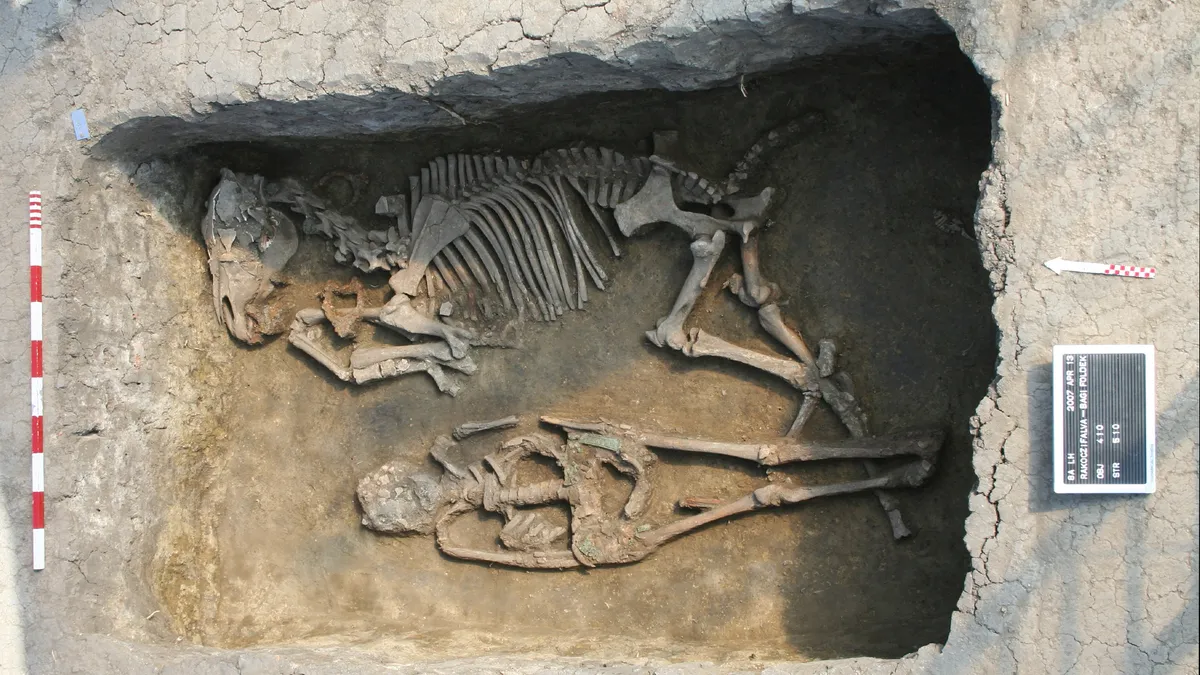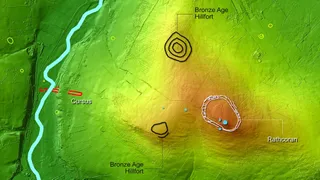
Lasers reveal prehistoric Irish monuments that may have been 'pathways for the dead'
Archaeologists used lidar to detect a cluster of rare Neolithic monuments hidden in farmland in Ireland.
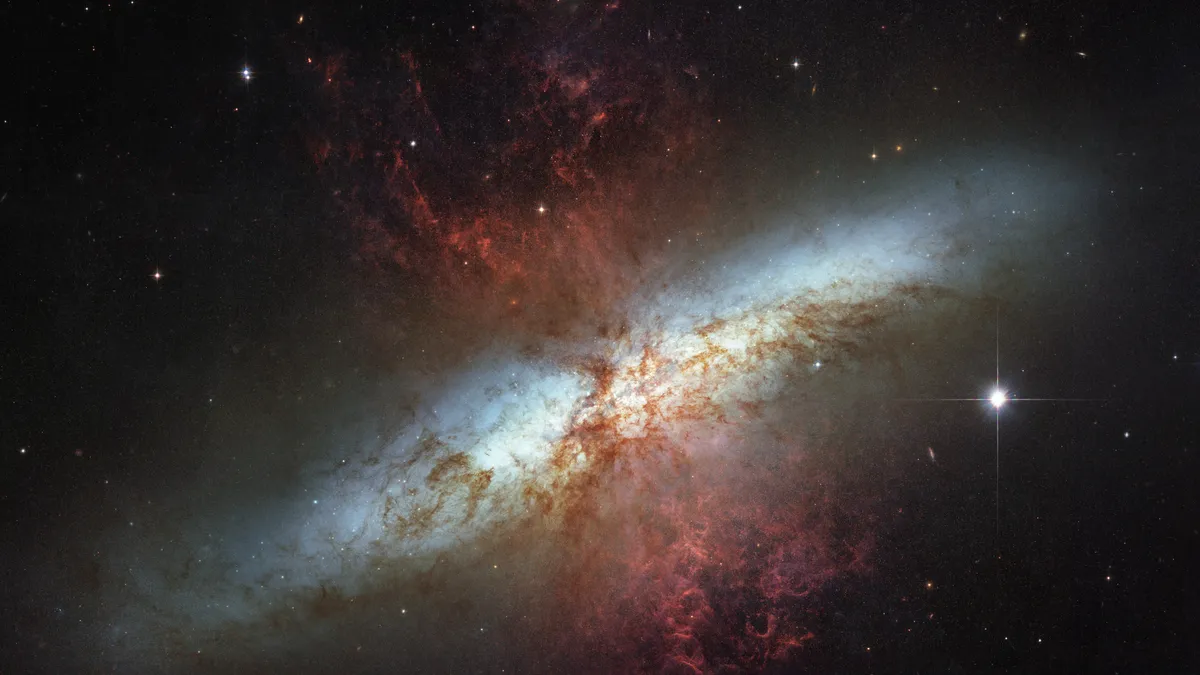
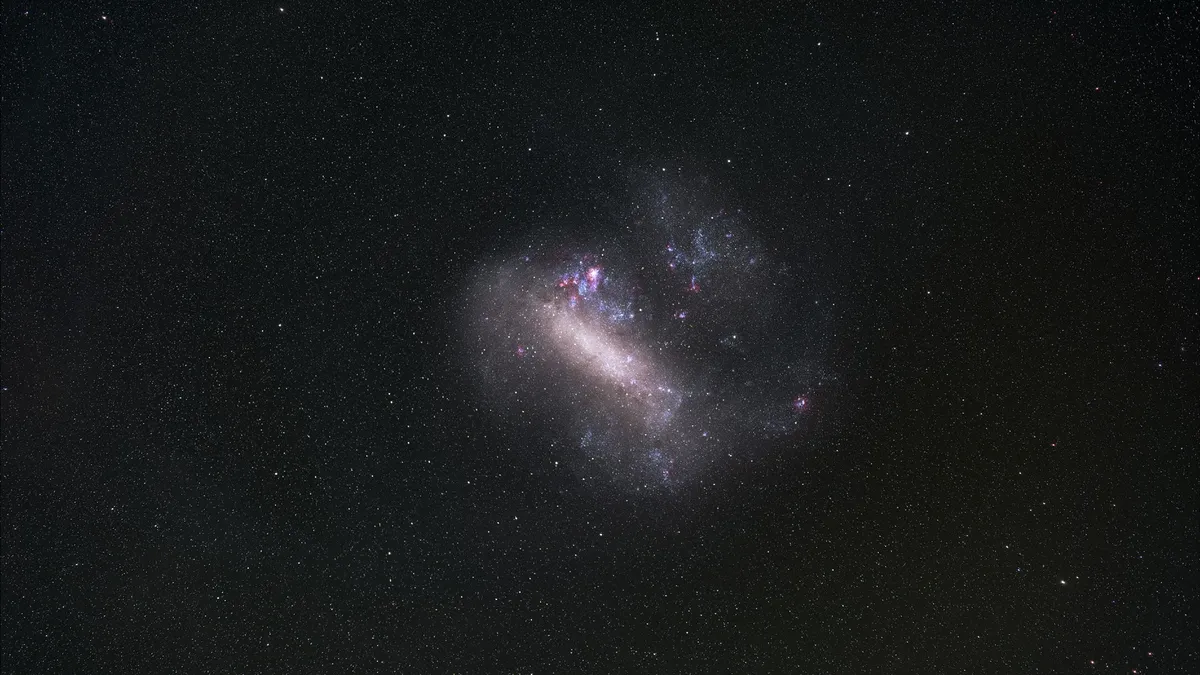
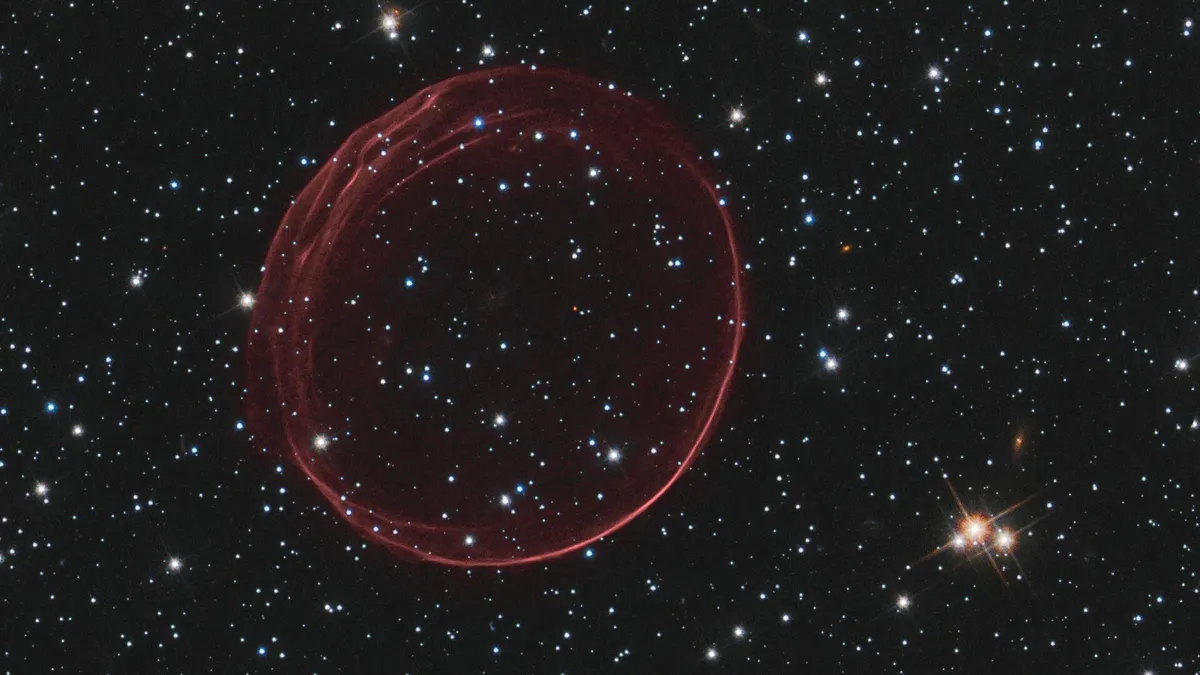
An incredibly brief, ultrabright explosion has led astronomers to a newfound magnetic star outside the Milky Way, which could be the first of many extragalactic magnetars, according to new research.
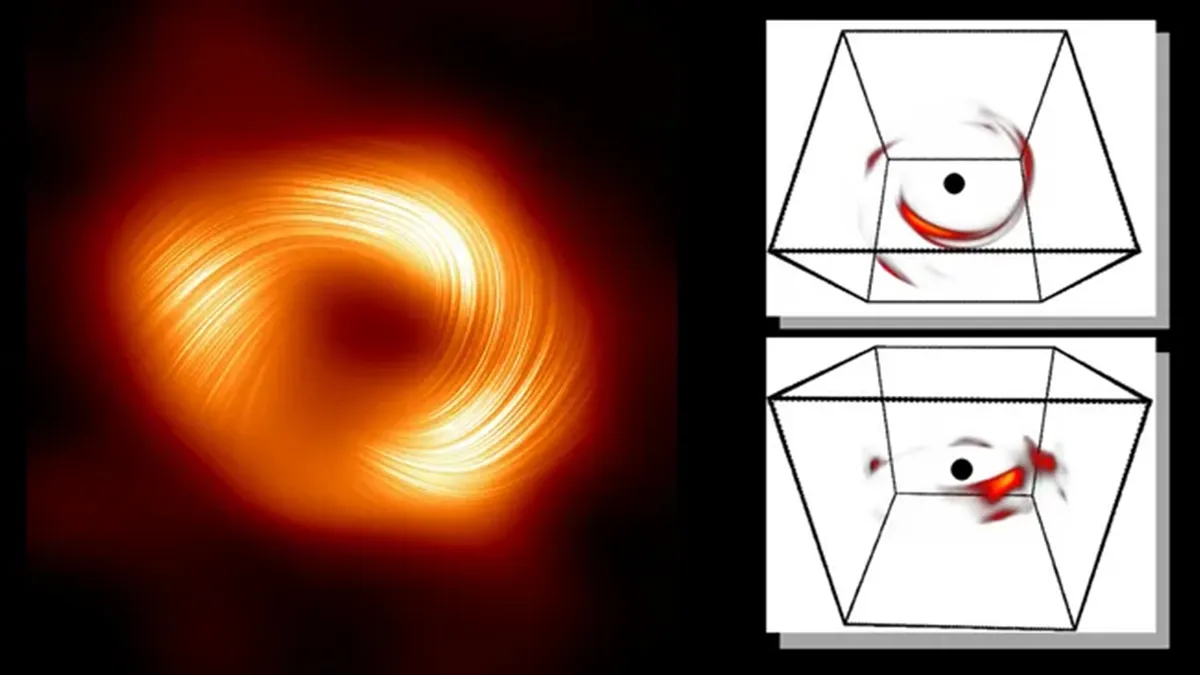
An explosive flare from the Milky Way's central black hole has been translated from 'a single flickering pixel' into a detailed 3D model using AI and Einstein's general relativity equations.

Deal Amazon are slashing $80 off this fantastic running watch at right now, which boasts two weeks of battery life.
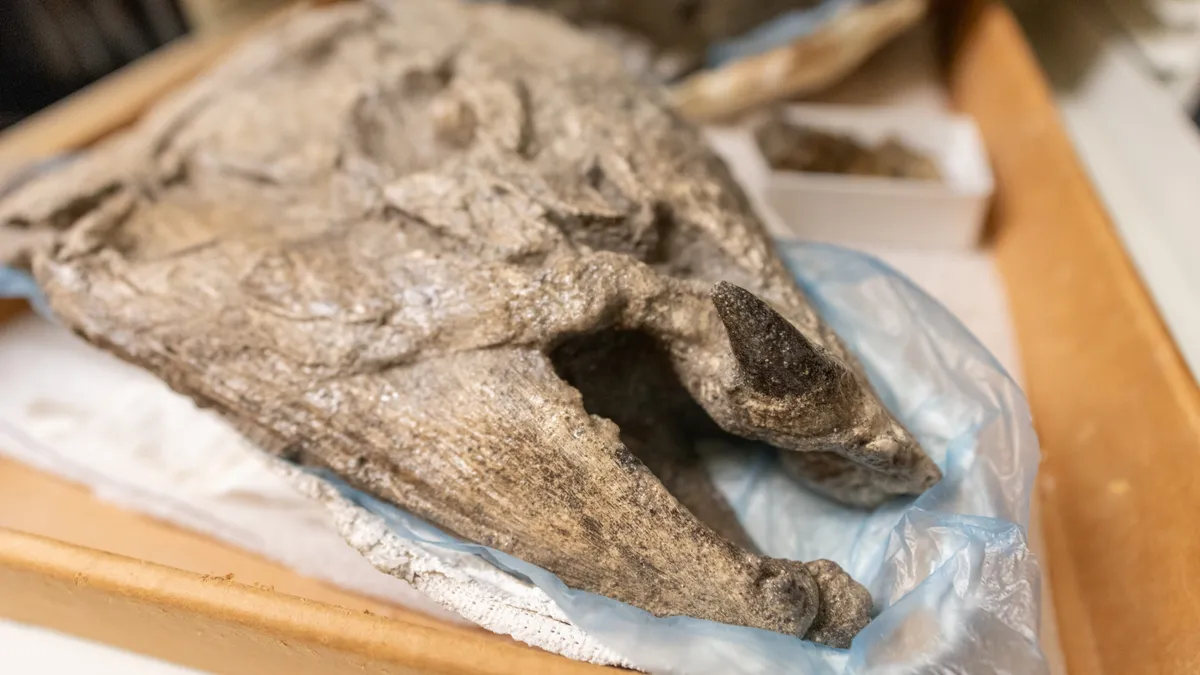
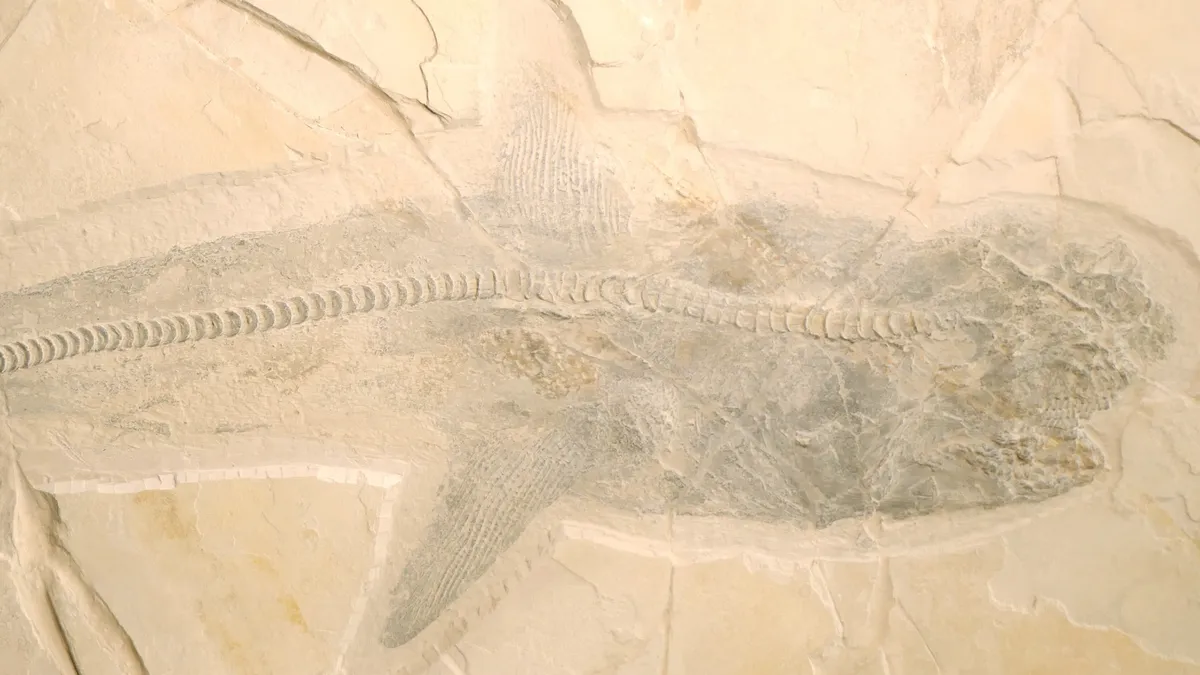
The largest salmon species ever discovered, Oncorhynchus rastrosus may have used its distinctive, tusk-like teeth to compete with rivals, defend against predators and dig nests.

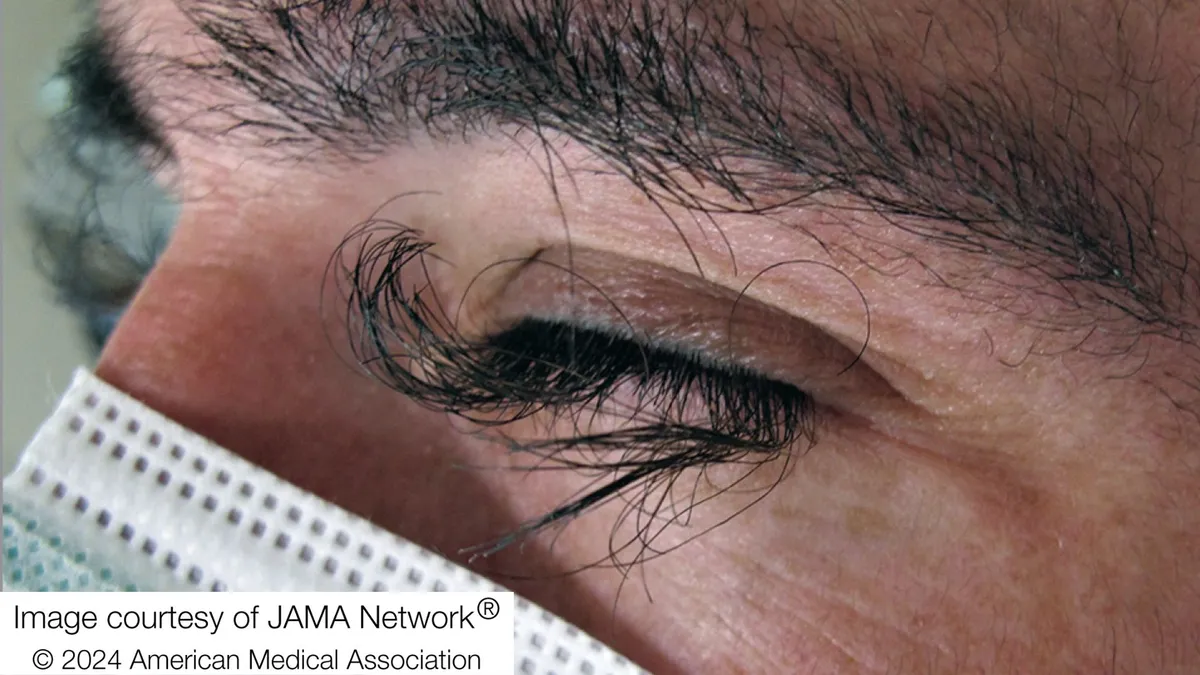
The causes range from innocuous media exposure to severe mental illness.

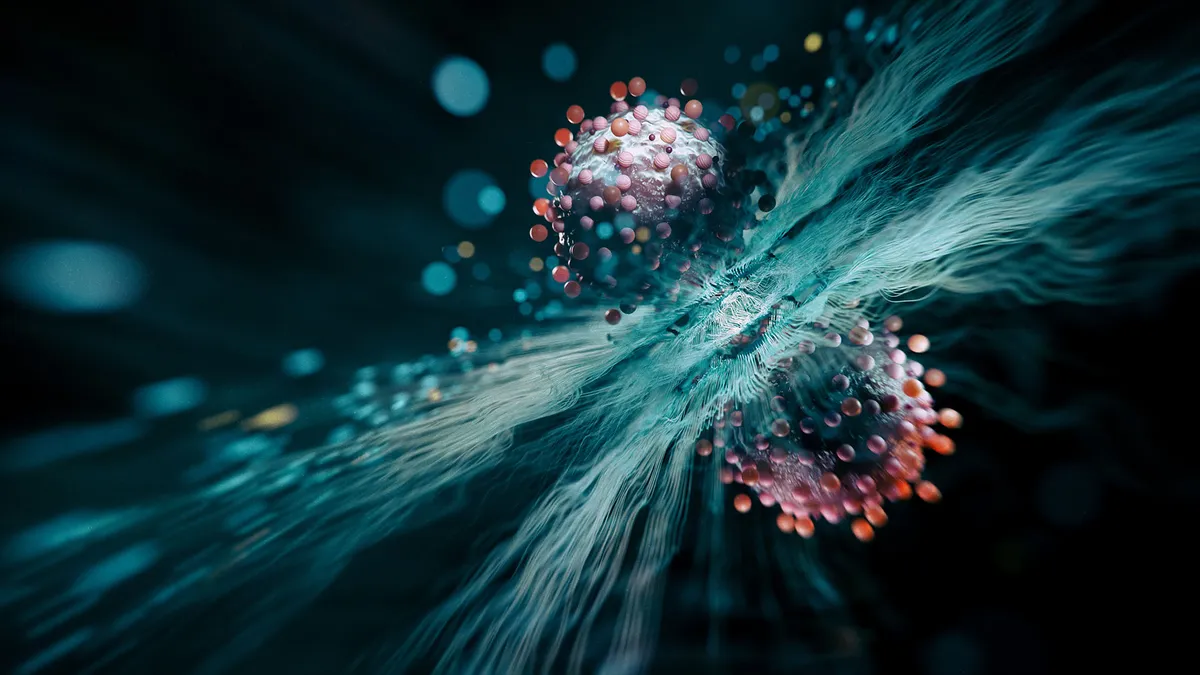
By precisely measuring the mass of neutrinos — ghostly particles that stream through your body by the billions each second — physicists could find some glaring holes in the Standard Model of particle physics. A new experiment has taken them one step closer.
With the nature of the universe's two most elusive components up for debate, physicists have proposed a radical idea: Invisible particles called tachyons, which break causality and move faster than light, may dominate the cosmos.
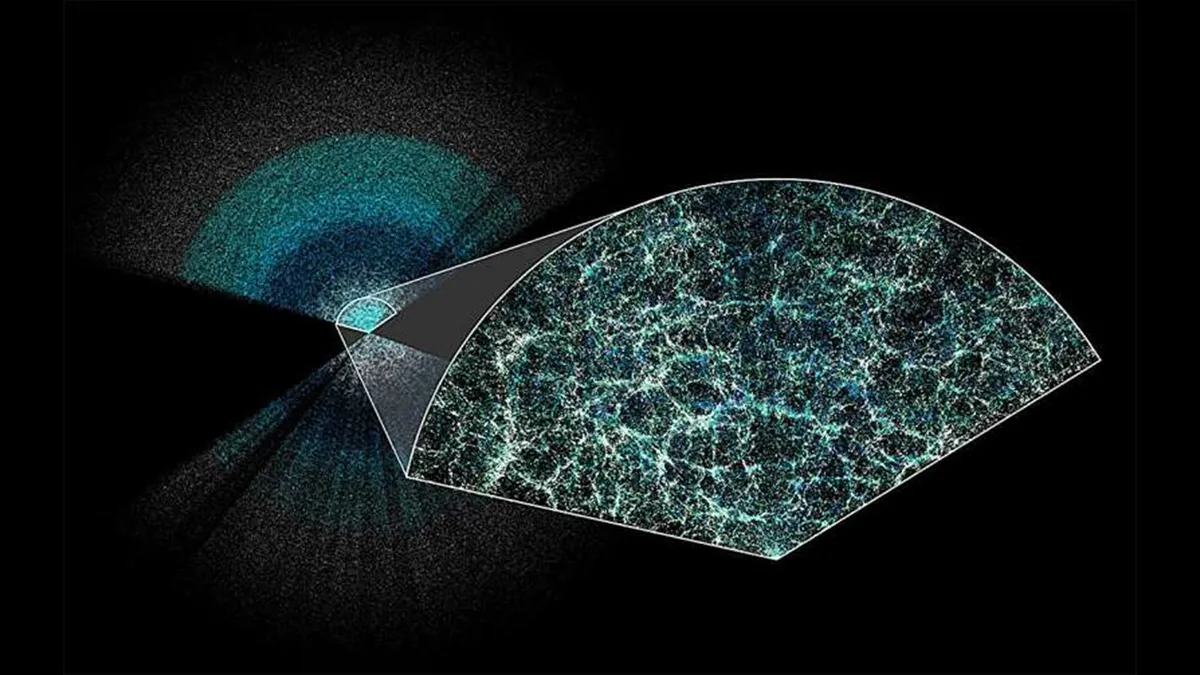
Scientists using the Dark Energy Spectroscopic Instrument have unveiled the largest 3D map of the universe ever. The results suggest that dark energy, the mysterious force pulling the universe apart, may be weakening, challenging prevailing theories of cosmology.
More than two decades ago, scientists predicted that at ultra-low temperatures, many atoms could undergo 'quantum superchemistry' and chemically react as one. They've finally shown it's real.
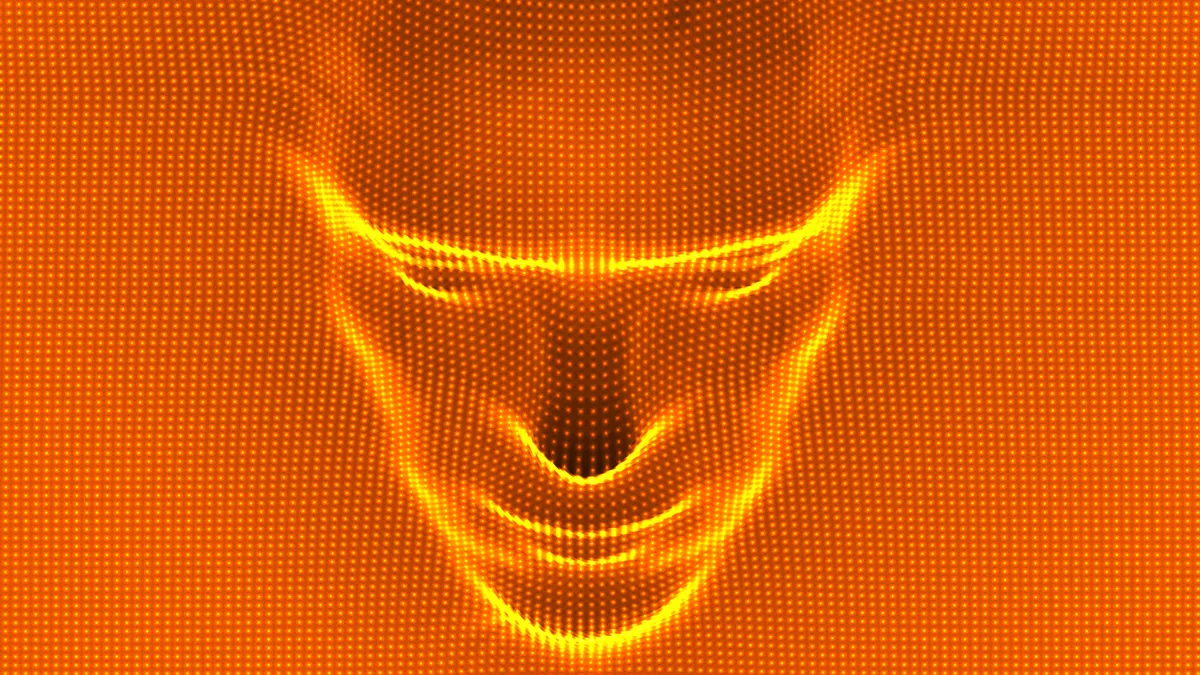
Anthropic's AI tool has beaten GPT-4 in key metrics and has a few surprises up its sleeve — including pontificating about its existence and realizing when it was being tested.