


Timeline of Hurricane Sandy's Week of Destruction (Infographic)
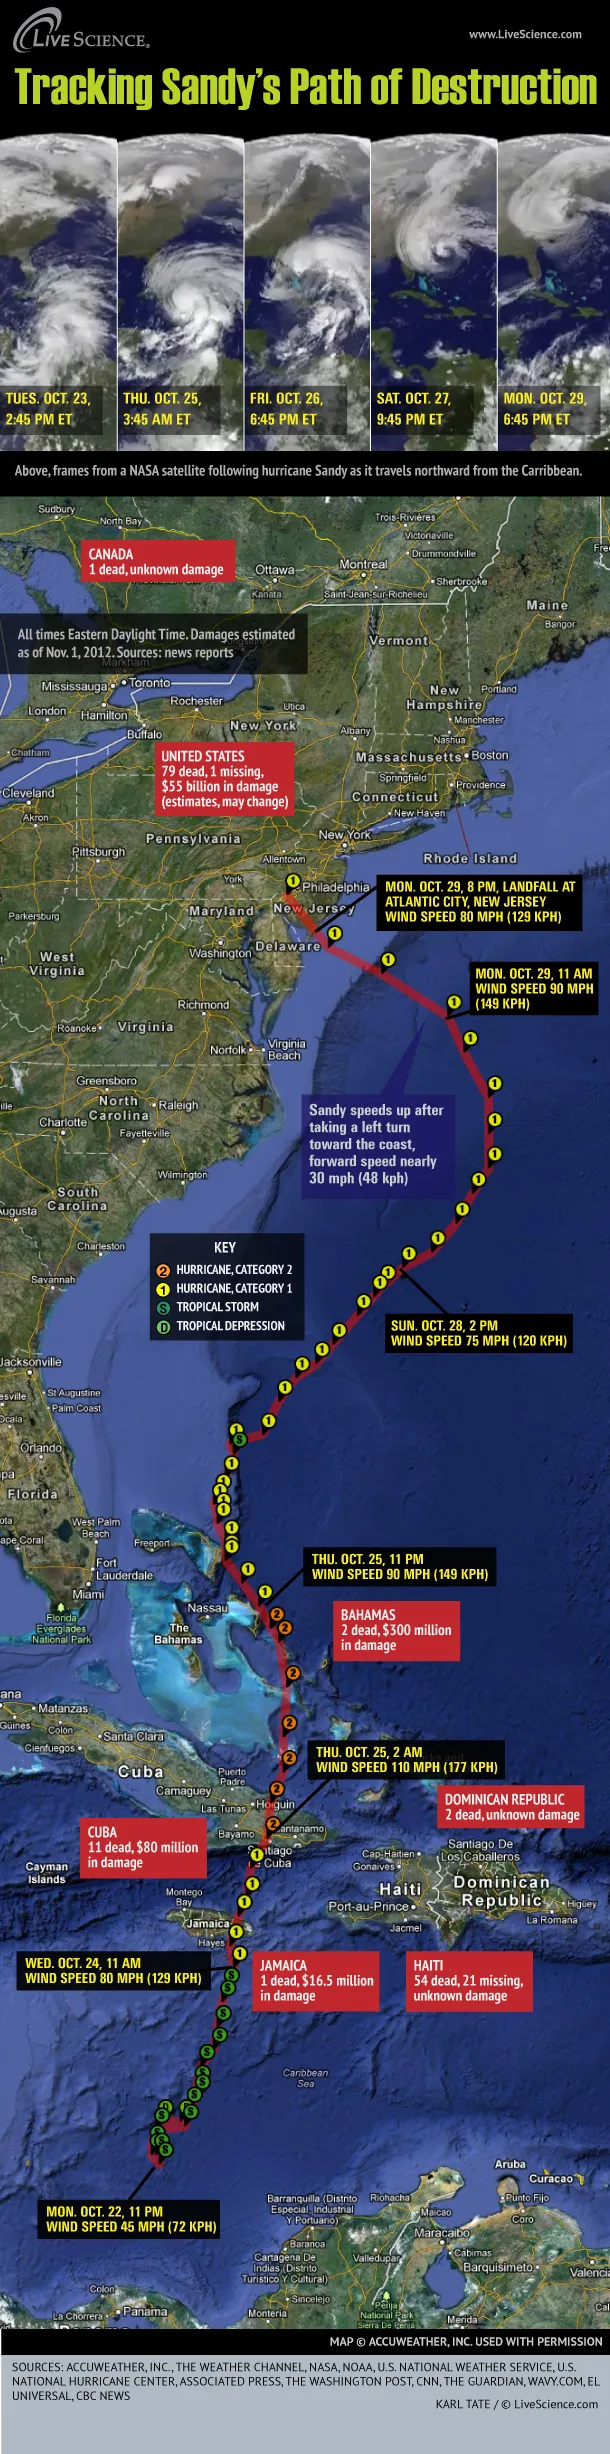
Hurricane Sandy, a late-season post-tropical cyclone, swept through the Caribbean and up the East Coast of the United States in late October 2012. The storm left dozens dead, thousands homeless and millions without power. Total damage is expected to be in the billions of dollars.
Sandy began as a tropical wave in the Caribbean on Oct. 19. It quickly developed, becoming a tropical depression and then a tropical storm in just six hours. Tropical Storm Sandy was the 18th named storm of the 2012 Atlantic hurricane season. It was upgraded to a hurricane on Oct. 24 when its maximum sustained winds reached 74 mph (119 kph).
Sandy tore through the Caribbean, making landfall at Jamaica on Oct. 24. After leaving that island, the storm gained strength over open water and became a Category 2. The storm hit Cuba early Oct. 25, then weakened to a Category 1. On Oct. 26, it swept across the Bahamas. Sandy briefly weakened to a tropical storm on Oct. 27, then gained strength again to become a Category 1 hurricane before turning north toward the U.S. coast.
Hurricane Sandy made landfall in the United States about 8 p.m. EDT Oct. 29, striking near Atlantic City, N.J., with winds of 80 mph. By Nov. 1, Sandy had dissipated. The National Weather Service reported that "multiple remnants" were circulating across the lower Great Lakes region and moving into Canada. Some areas were getting residual rain and snow showers. Tides were back down to less than a foot above normal.
- Full coverage of Hurricane Sandy
- Hurricane Sandy: Photos of a Frankenstorm
- Sandy's Aftermath - NYC Subways Submerged | Raw Video
Get the world’s most fascinating discoveries delivered straight to your inbox.
