The 6.0-magnitude earthquake that rocked California's Napa Valley last month not only injured dozens of people and caused millions of dollars in damage, but it also warped the surface of Earth.
Satellites with radar vision can see how the Napa earthquake deformed the region from space.
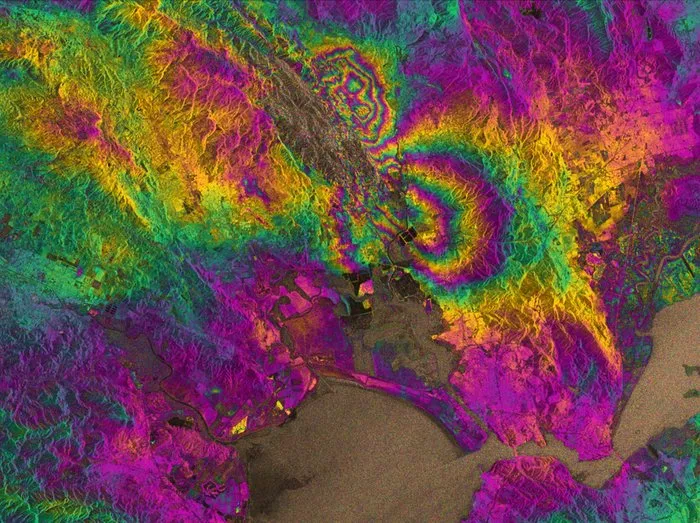
Observations from the European Space Agency's (ESA) new Sentinel-1A satellite reveal changes on the surface through a technique known as synthetic aperture radar interferometry. [In Images: 6.0-Magnitude Earthquake Shakes Northern California]
Latest Videos From
Ground deformation leads to small changes in the reflected radar signals, and the resulting interferogram has patterns of color that resemble the rippling rainbows sometimes seen on the surface of an oil slick.
The image is based on two observations from Sentinel-1A: one taken on Aug. 7, the day the satellite reached its operational orbit, and the other from Aug. 31, a week after the earthquake. Each color fringe corresponds to a deformation of about 1.1 inches (2.8 centimeters), and the maximum deformation is more than 3.9 inches (10 cm), according to ESA.
"The data from satellites are invaluable for completely identifying the surface break of the earthquake," Austin Elliott, a doctoral student at the University of California, Davis, who is part of the team mapping the earthquake rupture on the ground, said in a statement from ESA. "Deformation maps from satellite imagery guide us to places where rupture has not yet been mapped."
The Aug. 24 Napa earthquake, the biggest to hit the region in 25 years, occurred on the West Napa Fault, which is part of a huge fault zone extending outward from the San Andreas Fault. The patterns in the interferogram confirm the West Napa Fault as the culprit, according to ESA. The Sentinel-1A images also showed that the ground deformation extends farther north than the rupture scientists had so far mapped at the surface.
NASA will produce its own interferograms of the region to document the ground changes left by the tremor. The space agency announced last week that it planned to fly its Uninhabited Aerial Vehicle Synthetic Aperture Radar, or UAVSAR, aboard a modified C-20A aircraft over the Napa Valley area.
UAVSAR can measure movements of the ground of less than a half-inch (less than 1 cm) from an altitude of almost 8 miles (13 kilometers) above ground, according to NASA. By comparing new data from the survey with previous data acquired by the UAVSAR on previous missions over the same area, scientists will be able to determine if big displacements occurred along fault lines in the region.
Follow Megan Gannon on Twitter and Google+. Follow us @livescience, Facebook & Google+. Original article on Live Science.

 Live Science Plus