The Atlantic hurricane season has officially begun, and a new map reveals the ocean heat that drives this extreme weather.
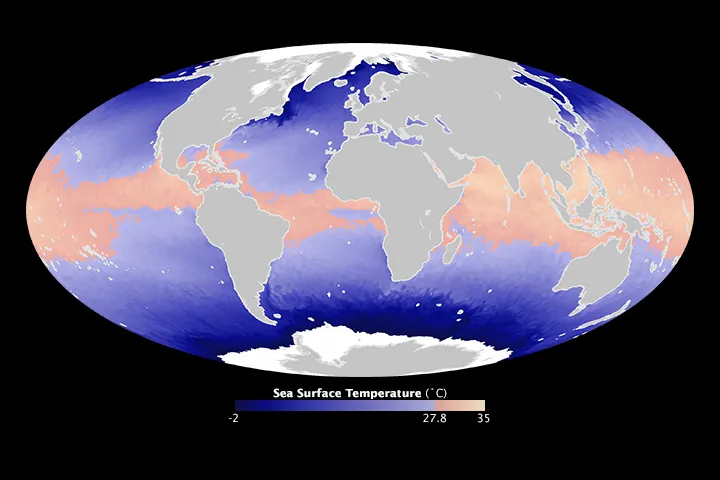
Derived from satellite data, the map shows a band of warmth around the equator on May 30, 2014, just before the Atlantic hurricane season's official start on June 1. The eastern Pacific season begins May 15 and has already produced the first 2014 storm: Amanda, which reached hurricane status over Memorial Day weekend. Hurricane Amanda quickly devolved into a tropical storm and petered out without ever threatening land.
The second named storm of the Pacific hurricane season, tropical depression Boris, is bringing heavy rain and the threat of flash flooding to southeastern Mexico, according to the National Hurricane Center. But Boris is not expected to become a tropical storm or hurricane. [Video: See Inside Hurricane Amanda]
Latest Videos From
Hurricanes (and their western Pacific cousins, typhoons and tropical cyclones) are fed by moist, warm air rising from the ocean. The warmer the surface temperature of the sea, the more likely hurricanes are to form.
The sea-surface temperatures on this map were made using satellite altimeters, such as the OSTM/JASON-2 satellite, according to NASA's Earth Observatory. These satellites measure the precise distance — down to centimeters — between the satellite and the ocean surface. Warm water expands, and cool water contracts, so warmer spots will rise measurably.
Temperatures of 82 degrees Fahrenheit (27.8 degrees Celsius) or greater are considered ideal for hurricane formation (other factors such as wind shear and air circulation patterns play roles as well). In this map, areas of the oceans at or above that temperature sweet spot appear in pink, while cooler regions are in blue.
This year, forecasters are predicting a fairly quiet Atlantic hurricane season, similar to the 2013 season. Last year, the number of hurricanes was below average, and the lowest since 1981. The weather pattern El Niño tends to squash the formation of Atlantic hurricanes with strong wind shears, and this pattern is currently setting up. However, the timing of El Niño's arrival is still in doubt, so a few big storms could sneak through first.
El Niño's effect is opposite in the Pacific, where the pattern lessens wind shear. This cycle may be the reason that Hurricane Amanda formed early in the season and became the strongest May hurricane on record.
The Atlantic has yet to spawn any storms this season, though the strongest storms usually don't arrive on the scene until August through October. Atlantic hurricane season ends on Nov. 30.
Editor's Note: If you have an amazing weather or general science photo you'd like to share for a possible story or image gallery, please contact managing editor Jeanna Bryner at LSphotos@livescience.com.
Follow Stephanie Pappas on Twitter and Google+. Follow us @livescience, Facebook & Google+. Original article on Live Science.

 Live Science Plus