
 Live Science Plus


Anatomy of a Disaster: Mapping Catastrophe in 3-D
In the chaotic aftermath of a natural disaster, recording the devastation in minute detail might seem like a macabre pursuit. But researchers are increasingly doing just that with laser technology that, they say, can help them better understand the colossal forces at work, and can help better prepare communities for the next catastrophe.
Research teams are documenting the effects, both large and small, of natural disasters from earthquakes to tsunamis to wildfires with astonishing precision and producing some impressive visuals along the way.
LiDAR, which stands for Light Detection And Ranging, allows researchers to move into the field right after a calamity and, in the space of a few hours, gather data that reveal a disaster's footprint much like detectives photographing a crime scene, but in 3-D and with centimeter-level detail.
After returning to the safety of a computer lab, researchers process their data and can produce an animated reconstruction of the disaster site.
"The idea is that it's a virtual world you can explore without being physically present in that dangerous environment. You can move through it in the software," said Oregon State University assistant professor Michael Olsen, an engineer who presented work on the use of LiDAR in disaster areas at the recent Geological Society of America meeting in Minneapolis.

Laser beams, in 3-D!
Instead of relying on light in the environment to reflect off a surface, like a traditional camera, a LiDAR scanner sends out its own "light" a laser and, by measuring the time it takes for the laser to bounce back to the device, it can layer distance into an image.
Olsen said the ground-based LiDAR systems he uses, which take roughly 100,000 data points per second, scan up and down and rotate 360 degrees. Once the system is set up on its tripod, a single scan takes about two minutes.
"It's line of sight, so whatever you see is what you get," he explained. Imaging a large area requires multiples scans, Olsen told OurAmazingPlanet.
Olsen led a team from OSU and the University of Hawaii that went to Chile to survey damage from the massive earthquake that struck in February 2010. The magnitude 8.8 quake sent a devastating tsunami crashing ashore, and Olsen's group visited some of the most-affected towns and villages along the coast.
{brightcove CMS_LS_16766}
The team arrived about two months after the catastrophe. "The ideal is to be there about a week after," Olsen said. "If you go too soon, search and rescue is going on and you don't want to be in the way," but if you go too late, cleanup efforts will have washed away some of the disaster's fingerprints, he said.
The research team also used LiDAR to document the aftermath of Japan's devastating earthquake and tsunami.
"We want to capture the perishable data," Olsen said. Seemingly minute details such as cracks in a building, or the way rivers of mud flow around a foundation, offer clues for earth scientists who are piecing together the anatomy of a tsunami wave or an earthquake.
In addition, those details help engineers and architects figure out how various parts of a building hold up during and immediately after a natural disaster.
"Ultimately, it translates back to better building codes," Olsen said. "The thing we always learn after these reconnaissance efforts is where we're overdesigning spending too much money or too much material in a certain spot that isn't really making a difference [compared] to areas where we're under-designing."
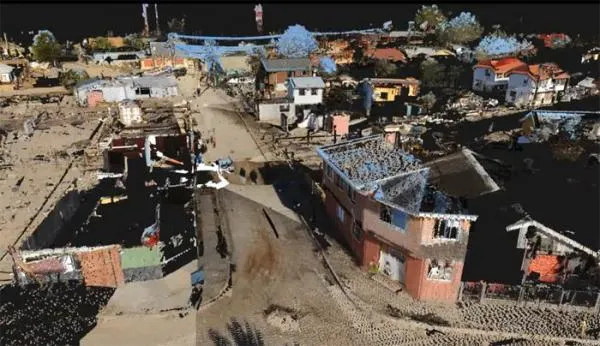
One animation Olsen's team put together takes a viewer through the tsunami-battered town of Dichato, Chile. It took three or four hours and 20 different scan positions to gather the data, then two weeks back in the lab, running the scans, along with digital photographs and GPS data, through computer programs, to produce the sequence, which has the look of a post-apocalyptic video game. [See the animation here.]

Before disaster strikes
Although post-disaster LiDAR scans are helpful, before-and-after disaster images are even more helpful, researchers said, because the scans can mathematically alert an observer to minute changes.
Federal entities such as the U.S. Geological Survey and the Federal Emergency Management Agency and various state agencies have begun to use aircraft-mounted LiDAR to map everything from flood plains to earthquake-prone regions to provide baseline pictures that can be used for comparison when an emergency does hit.
"In a flood, you can see, 'Oh, this channel eroded 1 centimeter.' You can make that measurement from these data, literally at the centimeter level. That's why earth scientists are so excited about it," said geologist Stephen DeLong, an assistant research professor at the University of Arizona who uses LiDAR.

DeLong uses ground-based LiDAR to look at the aftereffects of wildfires specifically, how fairly minor rainstorms can lead to major flooding when they hit a burned-out landscape. He presented research at the GSA meeting on this year's infamous Horseshoe Two wildfire in Arizona, based on LiDAR scans of mountainous regions before and after the disaster.
"There have been fires this year and last year in Arizona where the floods after the fires were more destructive than the fires themselves, to humans and to property," DeLong told OurAmazingPlanet.
DeLong said LiDAR mapping can help land-management agencies predict where floods and debris flows will land after wildfires.
"Last year in Flagstaff, Ariz., all these people who lived downstream of the fires had their homes destroyed by floods and sediment, so the public needs to know about these things," DeLong said.
As a fairly new tool for the earth science community, LiDAR presents some challenges, DeLong said. The technology was developed more for civil engineers, and has been used more frequently to image the sharp-angled constructions made by humans, as opposed to the undulating profile of a cliff wall or a hilly forest.
But LiDAR scanning means that even the most subtle effects of a natural disaster can no longer escape notice. [Natural Disasters: Top 10 U.S. Threats]
"We're making these very detailed maps of how landscapes are changing as a result of floods or landslides or earthquakes," DeLong said. "This allows you to work in three dimensions. You need a three-dimensional method to look at how three-dimensional landforms change."
- 7 Ways the Earth Changes in the Blink of an Eye
- Infographic: Tallest Mountain to Deepest Ocean Trench
- In Pictures: Japan Earthquake and Tsunami
You can follow OurAmazingPlanet staff writer Andrea Mustain on Twitter: @andreamustain. Follow OurAmazingPlanet for the latest in Earth science and exploration news on Twitter @OAPlanet and on Facebook.
Get the world’s most fascinating discoveries delivered straight to your inbox.