Dramatic images capture rapid slide of Antarctic glacier

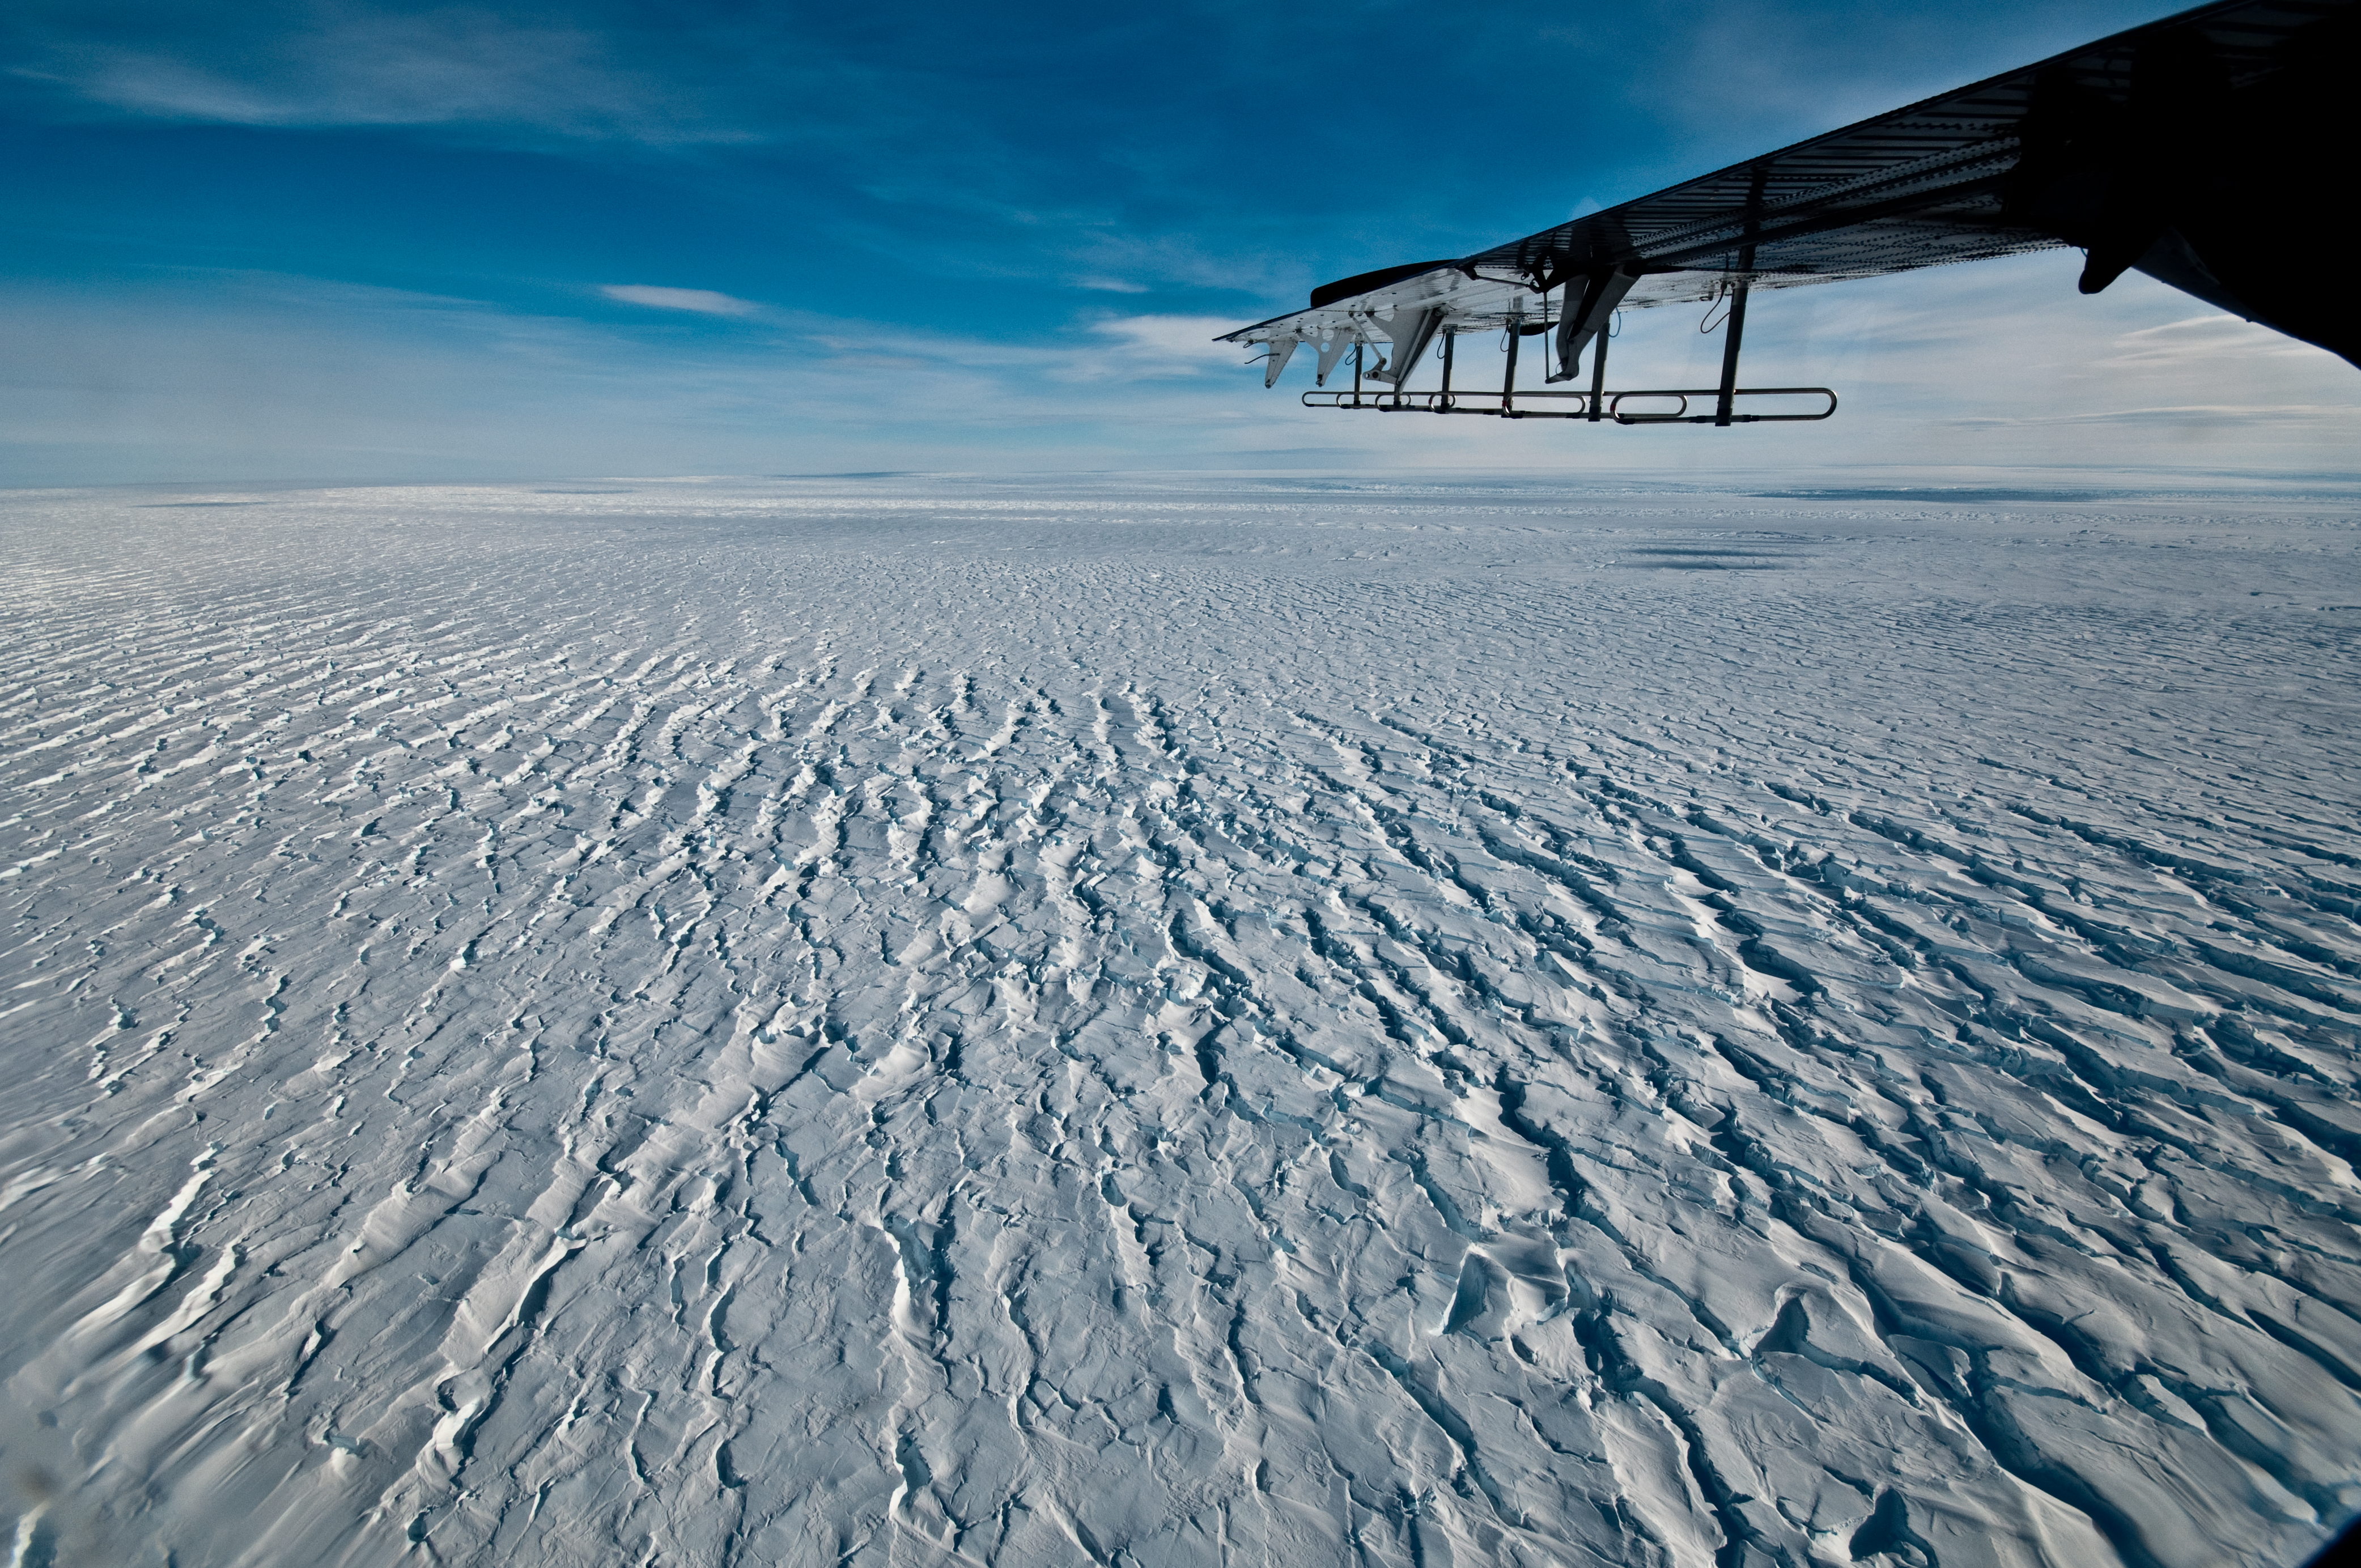
Pine Island Glacier, one of the fastest-shrinking glaciers in Antarctica, hastened its slide into the sea between 2017 and 2020, when one-fifth of its associated ice shelf broke off as massive icebergs, a new study reveals.
The glacier sped up another time in recent history, between the 1990s and 2009, when warm ocean currents ate away at the underside of the ice shelf, destabilizing its structure and causing the glacier to accelerate toward open water, according to a 2010 report in the journal Geophysical Research Letters.
The ice shelf lies at the seaward edge of the glacier and scrapes against the land on each side, as well as some of the seafloor beneath, thus slowing the flow of glacial ice into the Amundsen Sea off of West Antarctica. As this frozen barrier melted away over the course of two decades, the glacier's movement toward the sea accelerated from 1.5 miles (2.5 kilometers) per year to 2.5 miles (4 km) per year, according to the 2010 study.
Related: 10 signs that Earth's climate is off the rails
But whereas melting of the ice shelf caused this past acceleration, this time around, a more sudden, dramatic process drove the speed-up, according to a new study published Friday (June 11) in the journal Science Advances. Essentially, as the glacier moved, surface-level cracks and deep rifts appeared in its ice shelf; this network of fractures gave out in several locations, periodically causing huge chunks of the ice shelf to break free, first author Ian Joughin, a glaciologist at the University of Washington (UW) Applied Physics Laboratory, told Live Science.
As the ice shelf's area shrank by about 20% — representing a loss of 251 square miles (651 square km) of area — the glacier's speed increased by 12% near its edge, the team found. In high-resolution videos of the glacier, stitched together from satellite data, the sides of the ice shelf can be seen grating against the coastline, while large cracks break out across the center of the shelf and then suddenly snap.
Calving, when icebergs break free of an ice shelf, "has been known to be important for a long time, but this study demonstrates that floating ice loss from some locations has a much more dramatic impact on the glacier than if it breaks off in other regions," Christine Dow, Canada research chair in glacier hydrology and ice dynamics at the University of Waterloo in Ontario, told Live Science in an email.
Get the world’s most fascinating discoveries delivered straight to your inbox.
"This is an interesting finding and explains a lot of recent change in the glacier. However, a bit more work is required to find out how fast the glacier will collapse," said Dow, who was not involved in the new study. For instance, it's unclear exactly what drives the formation of the troublesome cracks, whether they will appear more frequently in the future or how the flow of water beneath the glacier itself might contribute to this process, she said.
The finding does hint that the Pine Island ice shelf may collapse more rapidly than previously projected — over the course of decades, rather than centuries, Joughin said. This could hasten the whole glacier's collapse, in turn. But as Dow mentioned, the exact timing of that breakdown remains uncertain. "The changes are rapid and concerning, but not immediately catastrophic," he noted. "Nothing's going to happen overnight."

Satellite images capture ice shelf retreat
Pine Island Glacier and the neighboring Thwaites Glacier contain enough ice to raise global sea levels by about 4 feet (1.2 meters), should all that vulnerable ice collapse into the sea, according to the NASA Earth Observatory. Currently, Pine Island Glacier contributes about 0.006 inches (0.167 millimeters) of sea-level rise each year, but that rate may increase in the future, Joughin said.
Past studies showed how melting at the so-called grounding line — the point where the floating ice shelf first loses contact with the seafloor — drove previous accelerations of the glacier. These speed-ups occurred in "fits and starts" as the grounding line retreated, since this loss of ice caused the glacier to jut forward until it got snagged on a new ridge in the seafloor, Joughin explained. And after this series of accelerations, the glacier's speed remained fairly stable between 2009 and mid-2017.
To understand what the glacier has been up to more recently, Joughin and his colleagues used images from the Copernicus Sentinel-1 satellites, which are operated by the European Space Agency and equipped with synthetic aperture radar (SAR). SAR images look like black-and-white photographs, but instead of taking a snapshot of visible light, SAR satellites project radio waves at the landscape and record the signals that bounce back, Joughin said.
Starting in 2015, the Copernicus Sentinel-1 satellites took snapshots of Pine Island Glacier every 12 days, and then after fall 2016, they began collecting data every six days. The researchers examined all the data collected between January 2015 and September 2020 and used the multitude of images to create detailed videos of the ice flow.
Related: Antarctica: The ice-covered bottom of the world (photos)
The team found that the calving rate of the ice shelf more than doubled in that time frame and that starting in September 2017, the disintegrating shelf lost significant contact with the shoreline on its southern margin. This appeared to coincide with a sudden acceleration of the glacier, which continued to speed up as more icebergs calved from the shelf over the next three years. At the same time, available data indicated "no obvious change in the ocean temperature variability" in the region, hinting that melt-driven thinning of the ice shelf likely wasn't to blame, the team noted.
To better understand what triggered the acceleration from 2017 to 2020, the team crafted an ice flow model of the glacier and ice shelf, taking into account local environmental conditions. They tested what the model would do if none of the outermost shelf had broken off into the sea, and they found that the speed-up wasn't as dramatic as what they saw in the SAR footage. The team then tried lopping off huge chunks of the shelf, as occurred in real life, and the glacier accelerated accordingly.
"The only change I made is that I removed that part of the ice shelf," Joughin said. "The speed of the model was very close to that which was observed in nature."
That said, although the model came very close to reflecting the SAR footage, there is "still a mismatch" in the true and modeled flow speeds of the floating ice, particularly toward the ice shelf's seaward edge, Dow said. This hints that some physical systems may be acting on the ice flow but are still missing from the model, she said.
"It's not yet clear how important those missing pieces are for determining the future of Pine Island Glacier," Dow told Live Science.
For instance, Dow's own research group is currently investigating what role water flow beneath the glacier plays in the melt rates of the ice above. This subglacial water accumulates due to friction from the moving glacier and geothermal heat from the earth below; eventually, the fresh water slips out from under the glacier and enters the cavity beneath the ice shelf, thus mixing up the salty seawater found there. This may drive more warm water toward the grounding line and "potentially lead to faster retreat" of the ice shelf, but the new model doesn't take this process into account, Dow noted.
And there's another missing puzzle piece that scientists must address: When deep fractures appear in the ice shelf, what ultimately causes icebergs to snap free?
While scientists can model melt-driven thinning fairly well, "the part about the shelf breaking up gets into fracture mechanics," a tricky physical factor that also comes into play in earthquake prediction, Joughin said. "The bottom line is … it's hard to say when something is going to rupture or break," he said. Being better able to predict when the icebergs might calve off the ice shelf would allow scientists to better predict the subsequent speed-up of the glacier, as well as the related sea-level rise, he noted.
But even if the glacier speeds up again in the near future, its contribution to sea-level rise shouldn't suddenly spike to a catastrophic level in the realm of several feet a year, Joughin said. Again, the glacier currently contributes about 0.006 inches of sea-level rise annually, so "even if you tripled that, we'd only be at half-a-millimeter [0.02 inches] a year," he noted.
Originally published on Live Science.

Nicoletta Lanese is the health channel editor at Live Science and was previously a news editor and staff writer at the site. She holds a graduate certificate in science communication from UC Santa Cruz and degrees in neuroscience and dance from the University of Florida. Her work has appeared in The Scientist, Science News, the Mercury News, Mongabay and Stanford Medicine Magazine, among other outlets. Based in NYC, she also remains heavily involved in dance and performs in local choreographers' work.


