New Pollution Map Offers Unprecedented View of City's Air Quality
Get the world’s most fascinating discoveries delivered straight to your inbox.
You are now subscribed
Your newsletter sign-up was successful
Want to add more newsletters?

Delivered Daily
Daily Newsletter
Sign up for the latest discoveries, groundbreaking research and fascinating breakthroughs that impact you and the wider world direct to your inbox.

Once a week
Life's Little Mysteries
Feed your curiosity with an exclusive mystery every week, solved with science and delivered direct to your inbox before it's seen anywhere else.

Once a week
How It Works
Sign up to our free science & technology newsletter for your weekly fix of fascinating articles, quick quizzes, amazing images, and more

Delivered daily
Space.com Newsletter
Breaking space news, the latest updates on rocket launches, skywatching events and more!

Once a month
Watch This Space
Sign up to our monthly entertainment newsletter to keep up with all our coverage of the latest sci-fi and space movies, tv shows, games and books.

Once a week
Night Sky This Week
Discover this week's must-see night sky events, moon phases, and stunning astrophotos. Sign up for our skywatching newsletter and explore the universe with us!
Join the club
Get full access to premium articles, exclusive features and a growing list of member rewards.
The data, which was collected by sensors on two Google Street View cars, could ultimately help everyone from policymakers to individuals make smarter choices about how to reduce pollution in a given city and increase awareness about how pollution varies in individual neighborhoods, the researchers said.
"The cars drove more than 15,000 miles [24,000 kilometers] in the study domain," said the study’s lead author, Joshua Apte, an assistant professor in the Department of Civil, Architectural and Environmental Engineering at the University of Texas at Austin. "They collected the largest data set ever of air pollution collected by cars driving down the streets of a single city." [In Photos: World's Most Polluted Places]
With such sharp resolution, Apte and his colleagues could see hotspots of pollution, discern any dramatic changes over short distances and tease out specific locations that had consistently good or bad air quality over a long period of time.
The study was the result of a collaboration between the Environmental Defense Fund; Aclima, which develops environmental sensing systems; and Google. The goal was to map and measure pollutants that impact human health and the environment. The results were published online June 5 in the journal Environmental Science & Technology.
Typically, air pollution in urban areas is measured by stationary monitoring sites that are equipped with sensors and are sparsely located around a city. On average, there are one to four sites per 1 million people in an urban area, Apte said. In Oakland, just three stationary monitors capture air quality data for the 78-square-mile (202 square km) city.
The data from these sites is used primarily for regulatory compliance with the Clean Air Act, Apte said. But, it doesn't provide the high-resolution spatial patterns of air quality.
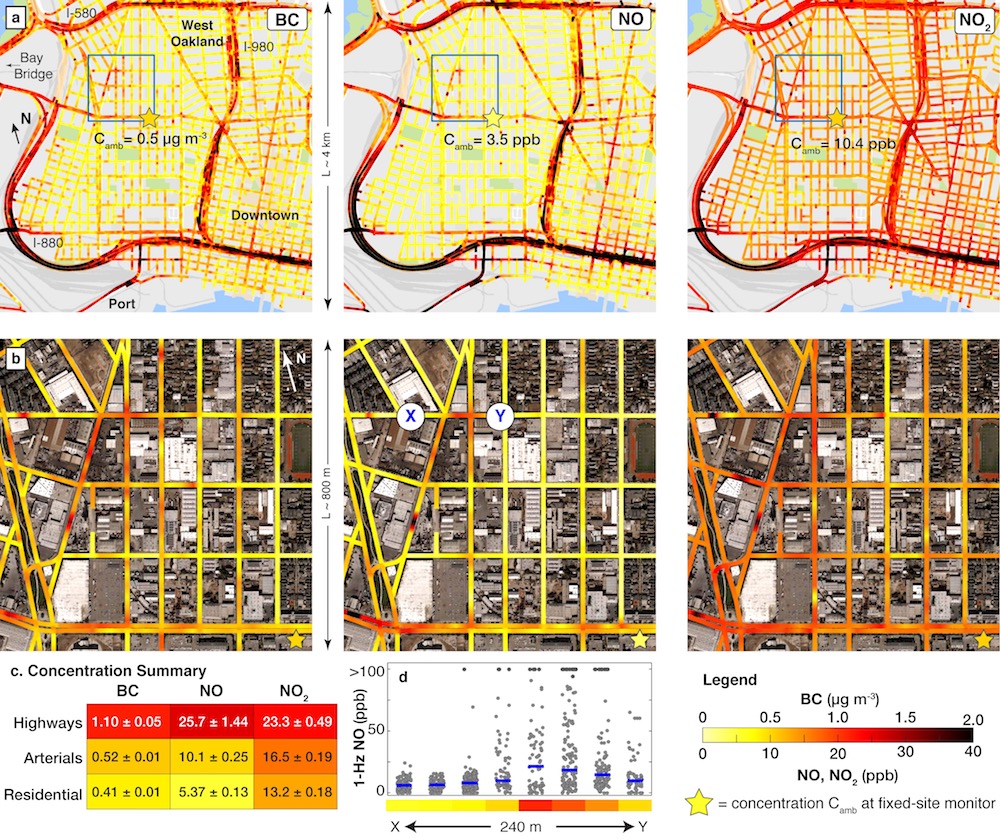
With the mobile method, Apte and his colleagues were able to get 100,000 times the resolution. They accomplished this with Aclima's mobile sensing platform using highly sensitive pollution instruments on the two cars, which drove down the same street an average of 30 times each and collected 3 million measurements of nitric oxide, nitrogen dioxide and black carbon.
Get the world’s most fascinating discoveries delivered straight to your inbox.
Some of the findings were expected, according to the researchers. Busy roads and industrial neighborhoods had higher levels of pollutants than quieter streets in mainly residential neighborhoods. But, a few findings stood out.
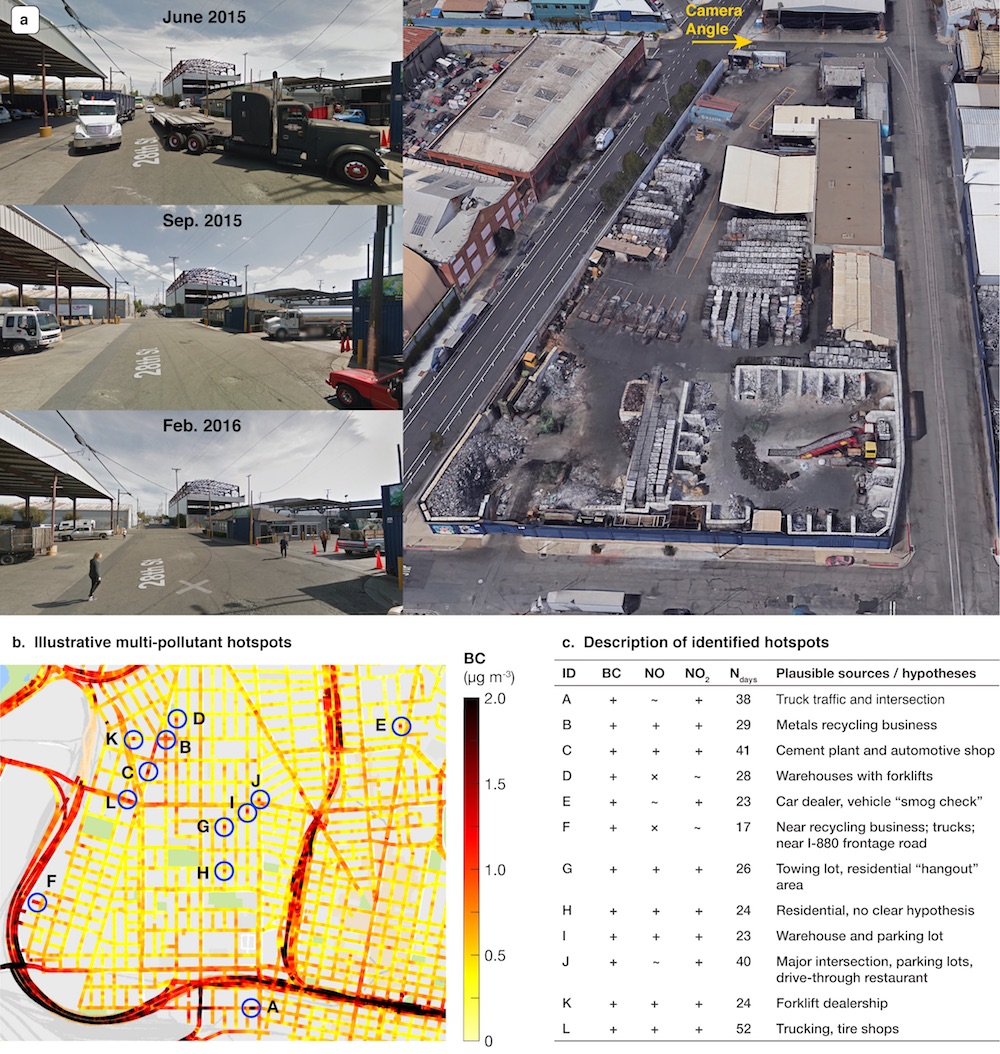
First, pollution can change greatly in a small area. There were many blocks where pollution varied by a factor of five or eight from one end of the block to the other, Apte said. There were also lots of hotspots — places less than 330 feet (100 meters) long — where the levels of pollution were substantially higher than what might have been expected. Last, the location of the hotspots stayed consistent over time, the researchers said.
Oakland is a city with industrial and residential zones comingled, which may account for the hotspots, but places like restaurants, car dealers, garages and even some homes showed up as hotspots time and time again, the study found. Until the creation of these new maps, those hotspots had been unknown.
"That's bad news and good news," Apte said.
The bad news is that pollution may be worse than scientists may have anticipated, he said. "The good news is that we may have more ways to reduce exposure to pollution than we might previously have thought," he added.
Apte said there is still a lot of data to sift through, and he expects to draw other conclusions from the pollution map. But, he said he would like to see these mobile monitoring techniques deployed in developing countries, where air pollution is a big problem, but where data is, practically speaking, nonexistent.
"We've just scratched the surface," he said.
Original article on Live Science.

 Live Science Plus


