


Complex Cirrus Clouds Seen in 3D from Space
Data, meet reality. A new NASA image shows how wispy cirrus clouds are measured by an instrument flying aboard the International Space Station (ISS).
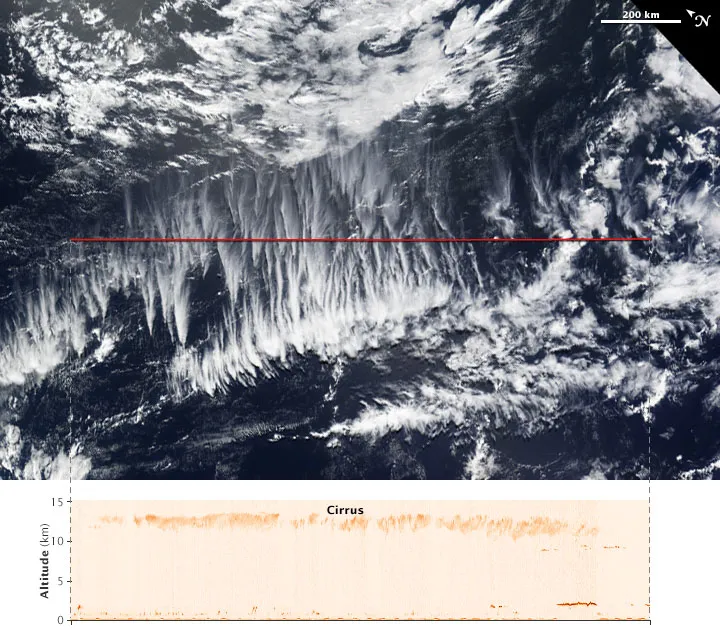
The Cloud-Aerosol Transport System (CATS) on the ISS scans the planet with lasers and records the light that bounces back, according to NASA Earth Observatory. On April 2, CATS took measurements (seen at the bottom of the image) of the clouds over the South Pacific. Shortly after, on the same day, NASA's Terra satellite swooped over and snapped a photo with its Moderate Resolution Imaging Spectroradiometer (MODIS).
The result is a dizzying view of high-altitude clouds that corresponds with a graph of the CATS data.
Clouds play a complicated role in the global climate system. Some cool the Earth, according to the National Science Foundation (NSF). Others warm it. Cirrus clouds are in the warming category: They let sunlight through, because they're so thin. But they're thick enough to trap heat from escaping from the atmosphere. [In Images: Mysterious Night-Shining Clouds]
In contrast, low-lying stratus clouds block sunlight and tend to cool the planet's surface, according to the NSF. Fluffy cumulous clouds can either block light or trap warmth, depending on their size and where they form.
Studying the role of clouds in climate is tough because clouds are so ephemeral. Their distribution might also change as the atmosphere warms, creating a complicated feedback cycle — and headaches for climate scientists trying to make the best estimates of future global warming. Estimates of global warming by the Intergovernmental Panel on Climate Change are made in ranges rather than specific numbers in part because of this uncertainty over the influence of clouds.
Cirrus clouds can cover 30 percent of the Earth's surface at a given time and form when water vapor high in the atmosphere freezes around mineral or metal particles. Scientists reporting in 2013 in the journal Science found that the particles necessary for the formation of cirrus clouds are very specific. Humans have increased the levels of these particles in the atmosphere by burning fossil fuels and developing land, the researchers told Live Science at the time. It's not clear, however, whether the changes in these particle levels will ultimately affect the number of cirrus clouds that form.
Get the world’s most fascinating discoveries delivered straight to your inbox.
The advantage of the CATS data, seen in orange in this image, is that it provides a 3D view of cirrus clouds. The clouds span from about 33,000 feet to 43,000 feet (10 to 13 kilometers).
"We are usually forced to make simplified assumptions and treat clouds as flat layers with only one cloud layer in a profile," Kerry Meyer, a cloud and aerosol scientist at NASA Goddard, told Earth Observatory. "These April 2 images show that clouds can be very complex."
Follow Stephanie Pappas on Twitter and Google+. Follow us @livescience, Facebook & Google+. Original article on Live Science.

Stephanie Pappas is a contributing writer for Live Science, covering topics ranging from geoscience to archaeology to the human brain and behavior. She was previously a senior writer for Live Science but is now a freelancer based in Denver, Colorado, and regularly contributes to Scientific American and The Monitor, the monthly magazine of the American Psychological Association. Stephanie received a bachelor's degree in psychology from the University of South Carolina and a graduate certificate in science communication from the University of California, Santa Cruz.