


Hurricane Sandy's Impact (Infographic)
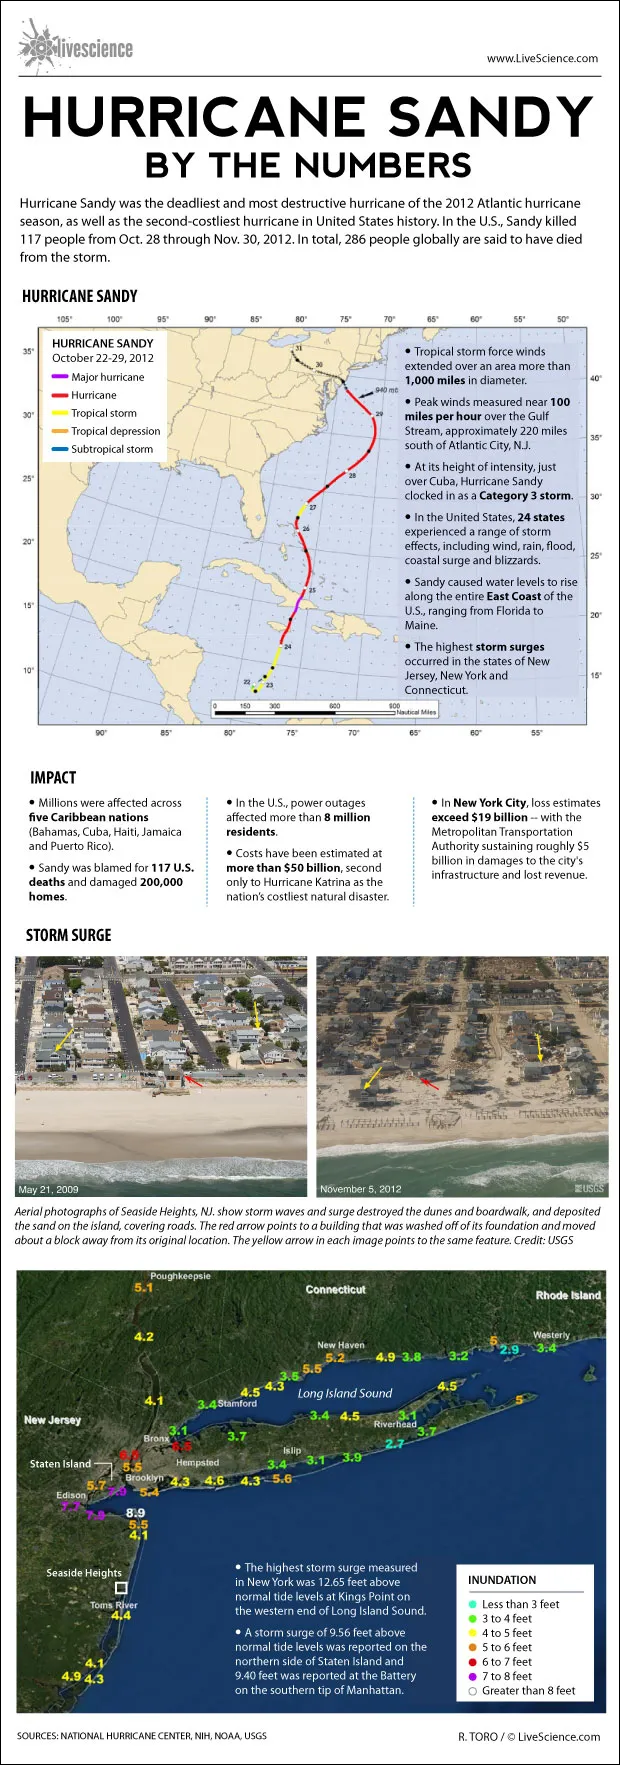
Hurricane Sandy was the deadliest and most destructive hurricane of the 2012 Atlantic hurricane season, as well as the second-costliest hurricane in United States history. In the U.S., Sandy killed 117 people from Oct. 28 through Nov. 30, 2012. In total, 286 people globally are said to have died from the storm.
Tropical storm force winds extended over an area more than 1,000 miles in diameter. Peak winds measured near 100 miles per hour over the Gulf Stream, approximately 220 miles south of Atlantic City, N.J.
At its height of intensity, just over Cuba, Hurricane Sandy clocked in as a Category 3 storm. In the United States, 24 states experienced a range of storm effects, including wind, rain, flood, coastal surge and blizzards.
Sandy caused water levels to rise along the entire East Coast of the U.S., ranging from Florida to Maine. The highest storm surges occurred in the states of New Jersey, New York and Connecticut.
Get the world’s most fascinating discoveries delivered straight to your inbox.
Millions were affected across five Caribbean nations (Bahamas, Cuba, Haiti, Jamaica and Puerto Rico). Sandy was blamed for 117 U.S. deaths and damaged 200,000 homes.
In the U.S., power outages affected more than 8 million residents.
Costs have been estimated at more than $50 billion, second only to Hurricane Katrina as the nation’s costliest natural disaster. In New York City, loss estimates exceed $19 billion -- with the Metropolitan Transportation Authority sustaining roughly $5 billion in damages to the city's infrastructure and lost revenue.
