A gleaming map that plots the paths tornadoes have taken across the United States over the course of nearly six decades has become something of an Internet sensation — a welcome, yet unexpected turn of events for the map's creator.
"It caught on, and I've been very surprised and happy with the response," said John Nelson, the user experience and mapping manager for IDV Solutions.
The Lansing, Mich.-based company turns data into interactive graphics for both the government and private-sector clients, but Nelson, who has a background in geography and design, said the tornado-track map was kind of a side project — something he did for fun.
Latest Videos From
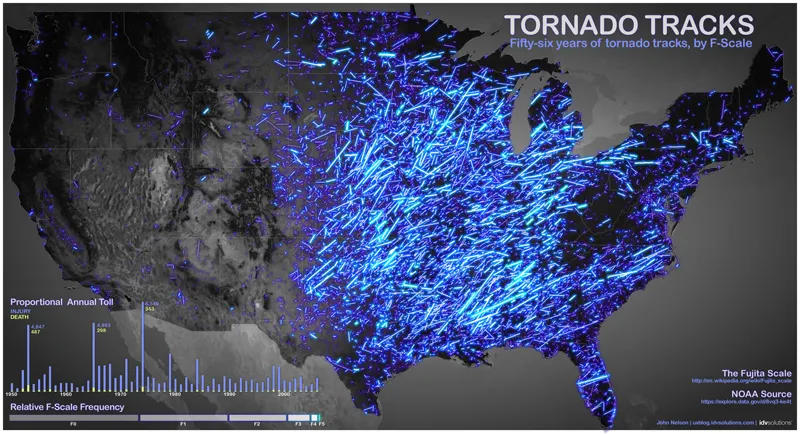
The map uses federal tornado data — essentially, where a tornado touched down, where it lifted off again, and how strong it was — from 1950 through 2006.
"I just connected those lines to get a general path the tornado took," Nelson told OurAmazingPlanet. "When you view it at the national scale, right away you've got these kind of claw marks," he said.
Storm scheme
Weaker tornadoes are dimmer and darker, and stronger tornadoes are brighter and bolder, according to their F number, or where they fall on the Fujita Scale, the classification system researchers used to rank the power of a tornado. (In recent years, forecasters have switched over to the more refined Enhanced Fujita Scale, or EF Scale.) [The Tornado Damage Scale in Images]
"Right away, I got a sense of hotspots, and areas that were unexpectedly devoid of tornadoes," Nelson said.
Yet some subtleties are important to understand, said Greg Carbin, the warning coordination meteorologist at the National Oceanic and Atmospheric Administration's Storm Prediction Center, and a man who maintains the nation's database of tornado statistics.
Some of the noticeably empty spots on the map — around the Appalachians and other mountainous areas in the eastern half of the United States — may not be as empty as they seem, Carbin said.
"Mountainous terrain tends to disrupt the airflow to some extent," he said, making it more difficult for the atmosphere to organize a tornado. However, he added, "It's not that they can't form in the mountains, but they're likely to be short-lived, so they're less likely to be seen."
Nuanced increase
Overall, Carbin said, there's been a tremendous increase in the number of tornadoes reported in recent years, but that's due almost entirely to nonmeteorological reasons. More tornadoes are being counted largely because we've gotten much better at seeing them.
There are more people living in more places, they have cellphones, and the National Weather Service has vastly improved its tornado-sensing capabilities; weak twisters that would have escaped notice in the past are getting added to annual tallies.
"What really matters are the strong tornadoes — which are not all that common," Carbin said. "Our understanding is that there may be only a couple days per century where a tornado of a significant magnitude will pass within 25 miles [40 kilometers] of your location. The tornadoes that are going to ruin your day just don't occur that often," he said.
Users will be able to tease out these details with the next version of the tornado map, which Nelson and his colleagues are busily creating. The interactive map, which will include data from 2012, will allow a user to filter tornadoes by strength, year, location, season and other factors, allowing for a better understanding of the nuances in the data.
"We're very excited, and we'll post that soon," Nelson said. "The general public can visit that [map] and start asking whatever questions they like."
Reach Andrea Mustain at amustain@techmedianetwork.com. Follow her on Twitter @AndreaMustain. Follow OurAmazingPlanet for the latest in Earth science and exploration news on Twitter @OAPlanet. We're also on Facebook & Google+.

 Live Science Plus