It's quick and easy to access Live Science Plus, simply enter your email below. We'll send you a confirmation and sign you up for our daily newsletter, keeping you up to date with the latest science news.
All of NASA's electronic eyes in space seem trained on Hurricane Sandy's march across the Northeast and Mid-Atlantic.
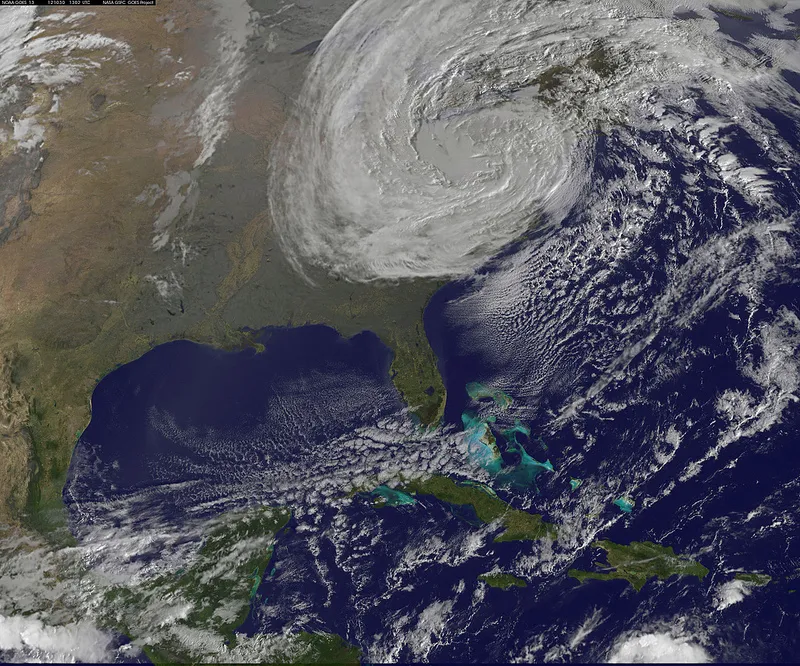
NOAA's GOES-13 satellite captured a visible image of post-tropical cyclone Sandy rolling overland this morning (Oct. 30) at 6:02 a.m. EDT. The powerful storm lost its hurricane status on Monday as its source of power shifted from warm ocean waters and air to interacting with a cold front along the coastline.
A nighttime view of Sandy was acquired overnight (Oct. 30) by the Visible Infrared Imaging Radiometer Suite (VIIRS) on the Suomi NPP satellite around 3:35 a.m. EDT. The cloud tops were illuminated by the full moon.
This nighttime view of Sandy was taken overnight (Oct. 30) by the Visible Infrared Imaging Radiometer Suite (VIIRS) on the Suomi NPP satellite around 3:35 a.m. EDT. The cloud tops were illuminated by the full moon.
(Image credit: NASA Earth Observatory)
The Suomi NPP satellite also snapped an image of Hurricane Sandy Monday night, just before the hurricane came ashore. Sandy made landfall at 8 p.m. EDT on Oct. 29, about 5 miles (8 kilometers) southwest of Atlantic City, N.J.
The Suomi NPP satellite also snapped an image of Hurricane Sandy Monday night, just before the hurricane came ashore. Sandy made landfall at 8 p.m. EDT on Oct. 29, about 5 miles (8 kilometers) southwest of Atlantic City, N.J.
(Image credit: NASA Earth Observatory.)
The effects of Sandy's winds appear to reach across the entire East Coast in a screenshot from an animated map by artists/technologists Fernanda Viégas and Martin Wattenberg. The map animation captured Sandy advancing north this morning (Oct. 30). The artists lead Google's "Big Picture" visualization research group in Cambridge, Mass., according to their website.
A screenshot of winds from Sandy at 11 a.m. EDT on Oct. 30. The map animation captured Sandy advancing north this morning.
(Image credit: Fernanda Viégas and Martin Wattenberg)
A NOAA GOES-13 satellite colorized infrared image was captured as the storm hit New Jersey. Infrared images help forecasters predict storm intensity overnight, providing information on the strength and direction of hurricanes and other storms.
Post-Tropical Cyclone Sandy made landfall at 8pm ET on October 29, 2012 about 5 miles southwest of Atlantic City, NJ, as seen in this NOAA GOES-13 satellite colorized infrared image from the same time.
(Image credit: National Oceanic and Atmospheric Administration (NOAA).)
The National Hurricane Center said that as of 5 a.m. Tuesday, Sandy was moving westward across Pennsylvania and was centered about 90 miles (145 km) west of Philadelphia. The NHC predicts the storm will move north into New York state.
Sign up for the Live Science daily newsletter now
Get the world’s most fascinating discoveries delivered straight to your inbox.
Though the storm has weakened, Sandy is still dangerous — expect sustained 80-mph winds (130 kph) along with heavy rainfall, surge and coastal and inland flooding as the storm continues to move inland, said a NASA statement.
For the science geek in everyone, Live Science offers a fascinating window into the natural and technological world, delivering comprehensive and compelling news and analysis on everything from dinosaur discoveries, archaeological finds and amazing animals to health, innovation and wearable technology. We aim to empower and inspire our readers with the tools needed to understand the world and appreciate its everyday awe.

 Live Science Plus