When an unusually cold stretch of weather grips much of the world, as one did in December, it can leave people wondering what ever happened to global warming. The gradual inching up of temperatures popularly known as climate change is alive and well, according to NASA.
The decade 2000 through 2009 was the warmest since reliable modern records have been kept, going back to 1880. There are, of course, monthly and even annual variations that buck the trend.
According to NASA's Earth Observatory, 2008 was the coolest year of the decade, and 2009 saw a return to near-record global temperatures (despite that frigid December, which was unseasonably cool for much of North America, Europe, and Asia).
Latest Videos From
2009 was only a fraction of a degree cooler than 2005, which is the warmest year on record. Importantly, 2009 tied with a cluster of other years — 1998, 2002, 2003, 2006 and 2007 1998 and 2007 — as the second warmest year since modern recordkeeping began in 1880.
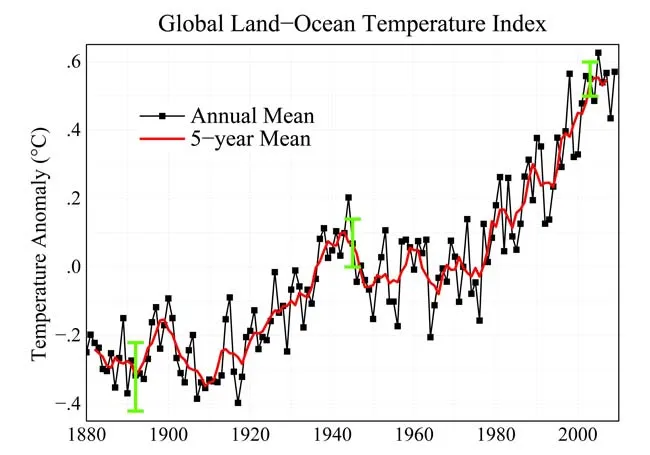
Throughout the last three decades, the GISS surface temperature record shows an upward trend of about 0.2°C (0.36°F) per decade.
Since 1880, when modern scientific instrumentation became available to monitor temperatures precisely, a clear warming trend is present, NASA said in a statement this week. In total, average global temperatures have increased by about 0.8°C (1.5°F) since 1880.
"That's the important number to keep in mind," said Gavin Schmidt, a climatologist at the Goddard Institute for Space Studies (GISS). "In contrast, the difference between, say, the second and sixth warmest years is trivial since the known uncertainty — or noise — in the temperature measurement is larger than some of the differences between the warmest years."
"There's always an interest in the annual temperature numbers and on a given year's ranking, but usually that misses the point," said GISS Director James Hansen. "There's substantial year-to-year variability of global temperature caused by the tropical El Niño-La Niña cycle. But when we average temperature over five or ten years to minimize that variability, we find that global warming is continuing unabated."
And what about that chilly December? Climate experts say we can continue to expect stretches that vary considerably from the norm.
In December, high air pressures in the Arctic decreased the east-west flow of the jet stream, while also increasing its tendency to blow from north to south and draw cold air southward from the Arctic. This resulted in an unusual effect that caused frigid air from the Arctic to rush into North America and warmer mid-latitude air to shift toward the north.
"Of course, the contiguous 48 states cover only 1.5 percent of the world area, so the U.S. temperature does not affect the global temperature much," Hansen said.
El Niño can have a great effect on any given month or year. El Nino is marked by warmer water in the Pacific off the coast of South America. It alters weather patterns in the United States and around the world.
An especially powerful El Niño cycle in 1998 is thought to have contributed to the unusually high temperatures that year, and Hansen's group estimates that there's a good chance 2010 will be the warmest year on record if the current El Niño persists. At most, scientists estimate that El Niño and its cool sister La Niña can cause global temperatures to deviate by about 0.2°C (0.36°F).
Warmer surface temperatures also tend to occur during particularly active parts of the solar cycle, known as solar maximums, while slightly cooler temperatures occur during lulls in activity, called minimums.
A deep solar minimum has made sunspots a rarity in the last few years. Such lulls in solar activity, which can cause the total amount of energy given off by the sun to decrease by about a tenth of a percent, typically spur surface temperature to dip slightly. Overall, solar minimums and maximums are thought to produce no more than 0.1°C (0.18°F) of cooling or warming.
"In 2009, it was clear that even the deepest solar minimum in the period of satellite data hasn't stopped global warming from continuing," Hansen said.