
 Live Science Plus


New Amazon Carbon Maps May Help Limit Deforestation
The vast jungle canopy of the Amazon looks like a solid wall of green from space to the human eye. But satellites and other high tech instruments can provide a much more nuanced view right down to the household level.
That might sound like something the CIA would be interested in, but there’s another audience that could benefit even more: forest managers and scientists looking to sequester the most carbon possible. Now a new study has provided them with that view by creating the most detailed carbon maps ever produced for the Amazon.
The Amazon currently stores an estimated 120 billion tons of carbon and sucks up an astonishing 25 percent of carbon dioxide emitted from natural and human sources. But threats from logging, slash-and-burn agriculture and oil and gas exploration threaten to disrupt these crucial processes that help keep the climate mostly in balance.

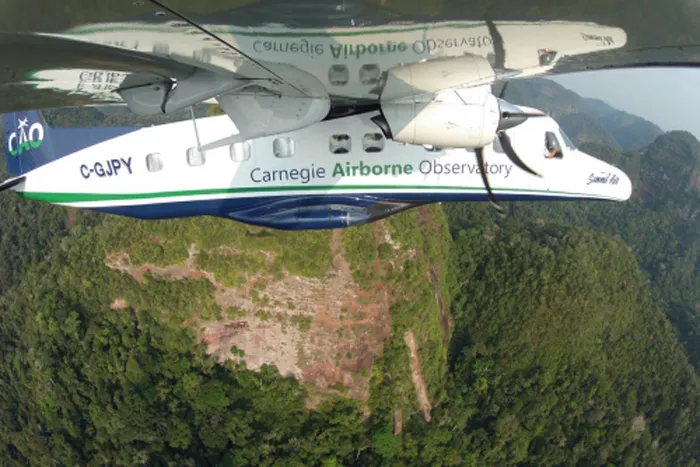
To provide detailed views on exactly how the forest is changing and where the most carbon dense areas are, scientists published details on a new high-resolution mapping technique using satellite imagery and an airborne remote-sensing technology called Lidar in a study in the Proceedings of the National Academy of Sciences on Monday. Scientists and governments can use the maps to see what areas of the Amazon need to be most protected from deforestation.
The threats to the Amazon in Peru are significant: More than 19.6 million hectares — 75,676 square miles, or roughly the size of Nebraska — have already been allowed to be logged or developed for oil and gas, the study says.
Other studies suggest as much as 65 percent of the Amazon’s biomass could be lost by 2060. Mining and oil palm plantations also threaten those forests, many of which are highly carbon-dense.
Greg Asner, the new study’s lead author and a staff scientist at the Carnegie Institution for Science in Stanford, Calif., and his team surveyed Amazonian and Andean forests in Peru. Their survey was able to find the areas of Peru that contained the most carbon and the carbon-filled areas that were at highest risk for being developed.
Get the world’s most fascinating discoveries delivered straight to your inbox.
Drying Amazon Could Be Major Carbon Concern NASA Warns of Climate Change’s Impact on the Amazon Amazon May Lose 65 Percent of Land Biomass by 2060
The carbon content of the land they surveyed ranged from almost zero carbon near the Pacific coast to 150 metric tons per hectare, or 2.47 acres, deep in the rainforest.
The team found an estimated 0.8 billion metric tons of stored carbon at risk of being released into the atmosphere because of deforestation. But if much of Peru’s lands with the highest carbon-storage potential were protected, they could store up to 3 billion metric tons of carbon nationwide, the team found.
In other words, if more of Peru’s rainforest were left unprotected, nearly a third of the carbon trapped in the trees and plants there would be released into the atmosphere, helping to fuel climate change and preventing future carbon emissions from being stored there.

“This study is the first anywhere in the world to provide a high-resolution, national-scale and geographically explicit accounting of vegetation carbon stocks in the tropics,” Asner told Climate Central. “Doing so allows two critically important steps forward in land use — climate change mitigation and ecological conservation.”
The mapping technique his team used helps researchers discover what parts of the rainforests are most threatened by deforestation and the parts of the forests containing the most carbon — land most in need of protection, at least from a climate change perspective, he said.
The accuracy and resolution of the map are so high that it’s accurate all the way down to individual pieces of property, allowing landowners to compare the carbon content of their land with that of their neighbors.
“This allows all stakeholders, large and small, to come to the table and to finally put forest carbon at the forefront of the effort to slow climate change,” Asner said. “I can’t emphasize enough how important this is to making forest carbon worth something, say, compared to other forms of land use such as surface mining or oil palm, which are major carbon emitters.”
The mapping technique can also be used in other parts of the globe to map carbon storage in other forests, but the remote sensing Lidar equipment would have to be recalibrated for forests outside the tropics, he said.
The technique and the carbon loss estimates it helps to produce could also be used to help scientists to determine how land use could affect changes in rainfall patterns in the Amazon, said Rong Fu, a University of Texas-Austin geoscientist whose research focuses on the connections between rainfall and forest burning in the Amazon.
Other recent research has shown rainfall in the Amazon is declining by as much as 25 percent over the past 14 years, partly because of a lack of greenness in the region. Deforestation is considered to be a factor in that decline.
If the trend continues, research suggests that parts of the Amazon could become savanna, preventing the lungs of the Earth from acting as one of the most important places carbon is stored naturally anywhere in the world.
You May Also Like: Sea Level Rise Making Floods Routine for Coastal Cities Europe Reaches Climate Deal, Sends Message An Ill Wind Blows in Antarctica, Threatens Global Flooding Calif. Plans Nation’s Most Detailed Sea Level Database San Francisco Rising to Threat of Swelling Seas
Originally published on Climate Central.