 Live Science Plus


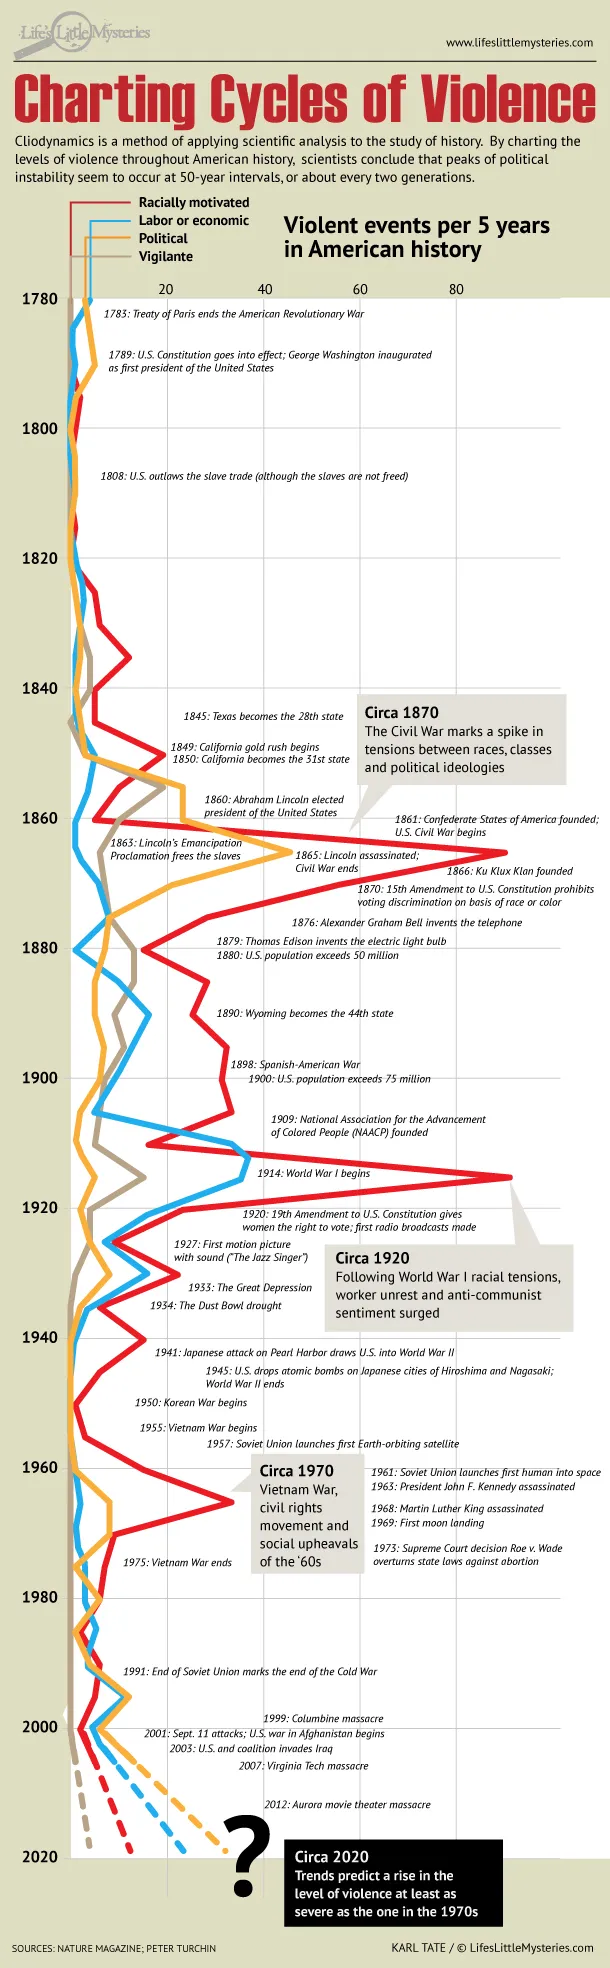
Peter Turchin, an ecologist, evolutionary biologist and mathematician at the University of Connecticut, has identified 50-year-long cycles of violence in United States history. The number of violent events, including civil war, riots, assassinations, terrorism and rampages, appears to have peaked in every other generation.
Turchin says his model predicts another peak in violence in 2020. However, other scientists and historians are skeptical about the ability to predict future outcomes based on historical observations.
Follow Life's Little Mysteries on Twitter @llmysteries. We're also on Facebook & Google+.

LATEST ARTICLES
