The "bomb cyclone," with its whipping winds and foot-plus snowdrifts, has passed, but even more teeth-chattering weather has blanketed the eastern U.S. in its wake.
Temperatures of 20 to 30 degrees Fahrenheit (11 to 17 degrees Celsius) below normal are keeping people bundled up from the Midwest to the Northeast, according to the National Weather Service (NWS). With the blistering winds fueled by the storm, temperatures feel even colder still, with wind chills into the negative double-digits.
The cold has seeped even farther south, with temperatures in the 30s and 40s Fahrenheit (in the single digits Celsius) in South Florida. It's so cold people on social media have reported seeing frozen iguanas fall from trees, stunned by the chill. [Photos: The 9 Snowiest Places on Earth]
Latest Videos From
The frigid weather is part of an overall pattern that has held since the holidays, keeping the eastern half of the country shivering with an added boost from a particularly intense storm that helped to continue drawing air down from the Arctic, said Greg Carbin, branch chief for the NWS's Weather Prediction Center.
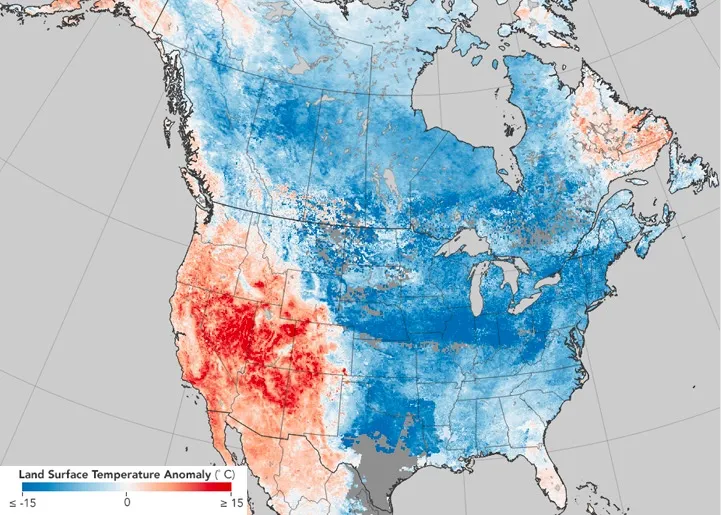
The East Coast is one of only a few cold spots on the global map, though, as most areas of the world are warmer than normal. As the planet's baseline temperature rises from continued human emissions of heat-trapping greenhouse gases, record cold becomes less and less likely.
Air pouring down from the Arctic has been keeping the eastern part of the country in a deep freeze for more than a week. For the week from Dec. 28 to Jan. 3, Chicago and New York both had the coldest average temperatures on record. Chicago's average of 6.4 degrees F (minus 14 degrees C) was more common of Bismarck, North Dakota, while New York's average of 17.4 degrees F (minus 8 degrees C) was more typical of Anchorage, Alaska.
"These are all pretty substantial cold weeks of record," Carbin told Live Science.
The storm that dumped snow over the Northeast on Thursday added a little oomph as it rapidly intensified, or "bombed out," off the coast. The central pressure of the storm dropped 50 millibars in 24 hours, a rare event that records suggest happens only once ever 25 to 30 years, Carbin said. (A millibar is a unit that effectively measures the weight of the atmosphere overhead.)
That rapid deepening fueled the storm's heavy snows and punishing winds and maintained the flow of Arctic air.
It "kind of just greases the skid for another blast," of frigid air, Carbin said.
Winds make temperatures feel even more bone-chilling. Temperatures at the summit of Mount Washington — notoriously one of the coldest and windiest spots in the country — could drop to minus 40 degrees F (minus 40 degrees C) with wind chills as low as minus 100 degrees F (minus 73 degrees C), according to forecasters at the peak's observatory.
The clear conditions settling in after the storm, along with the substantial snowpack, will also help depress temperatures through radiational cooling. Earth's surface radiates infrared energy at night, and with no clouds to absorb it and send some of it back, it escapes to space and temperatures can plummet.
But the deep freeze won't last forever, even if it seems like it already has. "It's difficult to sustain such an extreme pattern for very long, even in the midst of winter," Carbin said.
Temperatures will gradually start warming next week, and the temperature pattern over North America looks to flip toward the middle of the month. That means the eastern half of the country will be warmer than normal, while cooler and wetter weather affects the West.
Original article on Live Science.

 Live Science Plus