Diabetes in America: Full List of State Rankings
Get the world’s most fascinating discoveries delivered straight to your inbox.
You are now subscribed
Your newsletter sign-up was successful
Want to add more newsletters?
Delivered Daily
Daily Newsletter
Sign up for the latest discoveries, groundbreaking research and fascinating breakthroughs that impact you and the wider world direct to your inbox.
Once a week
Life's Little Mysteries
Feed your curiosity with an exclusive mystery every week, solved with science and delivered direct to your inbox before it's seen anywhere else.
Once a week
How It Works
Sign up to our free science & technology newsletter for your weekly fix of fascinating articles, quick quizzes, amazing images, and more
Delivered daily
Space.com Newsletter
Breaking space news, the latest updates on rocket launches, skywatching events and more!
Once a month
Watch This Space
Sign up to our monthly entertainment newsletter to keep up with all our coverage of the latest sci-fi and space movies, tv shows, games and books.
Once a week
Night Sky This Week
Discover this week's must-see night sky events, moon phases, and stunning astrophotos. Sign up for our skywatching newsletter and explore the universe with us!
Join the club
Get full access to premium articles, exclusive features and a growing list of member rewards.
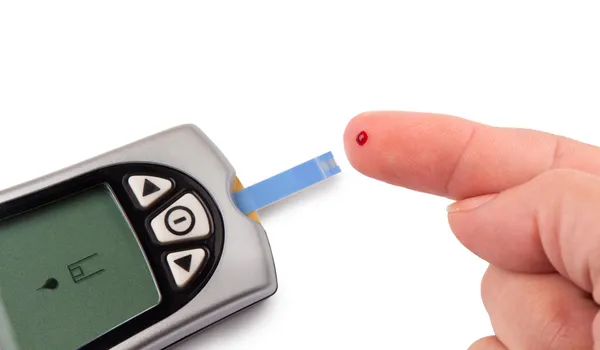
A new U.S. survey looks at the rate of diabetes in each state.
The survey — a poll from Gallup-Healthways — includes information from a nationally representative sample of more than 176,000 Americans in all 50 states in 2015.
Here's the full list of diabetes rates by state, ranked lowest to highest:
1. Utah: 7.4 percent
2. Rhode Island: 7.6 percent
3. Colorado: 7.9 percent
4. Minnesota: 8.4 percent
Get the world’s most fascinating discoveries delivered straight to your inbox.
5. Montana: 8.7 percent
6. Alaska: 8.8 percent
7. Massachusetts: 8.9 percent
8. Vermont: 8.9 percent
9. Nebraska: 9.1 percent
10. Wyoming: 9.3 percent
11. New Hampshire: 9.4 percent
12. Idaho: 9.7 percent
13. Connecticut: 9.8 percent
14. Washington: 10.1 percent
15. New Mexico: 10.1 percent
16. California: 10.2 percent
17. Iowa: 10.2 percent
18. Nevada: 10.2 percent
19. Oregon: 10.3 percent
20. Wisconsin: 10.4 percent
21. New Jersey: 10.4 percent
22. Illinois: 10.5 percent
23. South Dakota: 10.5 percent
24. North Dakota: 10.8 percent
25. Virginia: 10.8 percent
26. Delaware: 10.8 percent
27. Kansas: 10.9 percent
28. Hawaii: 11.1 percent
29. New York: 11.1 percent
30. Arizona: 11.3 percent
31. Maine: 11.5 percent
32. Pennsylvania: 11.8 percent
33. Texas: 11.8 percent
34. Florida: 11.9 percent
35. Maryland: 11.9 percent
36. Michigan: 12.0 percent
37. Indiana: 12.2 percent
38. Georgia: 12.7 percent
39. Oklahoma: 12.9 percent
40. Louisiana: 13.5 percent
41. North Carolina: 13.5 percent
42. Missouri: 13.5 percent
43. Ohio: 13.5 percent
44. Kentucky: 13.7 percent
45. Arkansas: 14.1 percent
46. South Carolina: 14.4 percent
47. Tennessee: 14.4 percent
48. Mississippi: 15.6 percent
49. West Virginia: 16.1 percent
50. Alabama: 16.1 percent
Original article on Live Science.

Rachael is a Live Science contributor, and was a former channel editor and senior writer for Live Science between 2010 and 2022. She has a master's degree in journalism from New York University's Science, Health and Environmental Reporting Program. She also holds a B.S. in molecular biology and an M.S. in biology from the University of California, San Diego. Her work has appeared in Scienceline, The Washington Post and Scientific American.
