
 Live Science Plus


Amazing Animation Shows Earthquake Ripple Across US

DENVER — An amazing new animation shows how earthquake waves travel across the United States, creating ripples over North America like a rock thrown into water.
The animation was made possible by an ambitious project called USArray, which deployed a mobile network of seismometers across the country over the course of a decade. The seismometers are sensitive enough to measure the ground moving by less than the width of a human hair.
"It allows us to actually image the inside of the Earth and lets us actually look at the rocks, and the interactions between these earthquake waves and the rocks that are beneath us," said Leah Pettis, an undergraduate student at the University of Arizona and a representative of EarthScope, a National Science Foundation program that co-manages the seismometers with the Incorporated Research Institutions for Seismology (IRIS).
The array can even capture weather events, including Hurricane Sandy in 2012.
Imaging the Earth
The ultimate goal of the project is to create a "sonogram of the belly of the Earth," John Taber, director of education and public outreach for IRIS, told LiveScience here at the annual meeting of the Geological Society of America. By capturing seismic waves as they move through the Earth, geoscientists can create images of what lies beneath the surface.
For example, the seafloor off the California coast is continuously pressing underneath North America like a conveyor belt — a process called subduction. The subducted crust doesn't just disappear, however; thanks to USArray, scientists can see a chunk of the tectonic plate that was last at the surface 30 million years ago. Today, it dips down some 1,740 miles (2,800 kilometers) under Florida.
Get the world’s most fascinating discoveries delivered straight to your inbox.
The seismometers are so sensitive that they capture mini-earthquakes that no one ever knew were happening. These quakes, of around magnitude 1.5, tell researchers more about where tectonic activity is occurring and which areas might be danger zones for larger quakes in the future.
Carpeting the entire United States with seismometers at one time wasn't feasible, so researchers took a piecemeal approach, deploying 400 seismometers, 42 miles (70 km) apart in strips, starting on the West Coast and gradually moving east. The final station was installed in Maine in early October, completing a process that began in 2004. Each seismometer station stays in place for 18 months to two years before leapfrogging eastward, thus covering the country in a rolling fashion.
Ripples in the crust
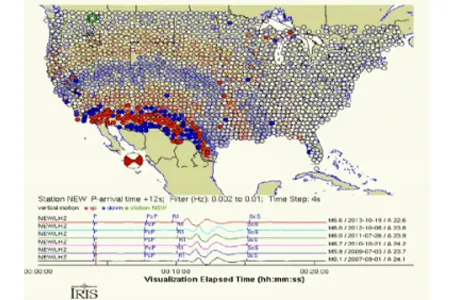
The new animation stitches together six earthquakes that occurred between 2007 and 2013 — the most recent of which was on Oct. 19, 2013. Each quake was centered in the Gulf of California between mainland Mexico and the Baja peninsula, and each was about a magnitude 6.0.
By gluing together the recordings from the seismometers during each quake, researchers can see what it would have looked like to have the whole country covered by seismometers during a quake like this. [See Animation of the Baja Quakes]
The animation first shows a faint signal from the conglomerate quake's P-wave, or the compressional wave that starts to make the ground shake. Next, a strong ripple travels from the Baja region northeastward as the seismometers pick up the surface waves, where energy moves close to the Earth's surface. The surface shaking is stronger in the Southeast, where the soil is loose and moves like Jell-O, than in the rest of the country, where hard rock is closer to the surface. (This soil difference is why a 2011 earthquake in Virginia was felt throughout the East Coast.)
More subtly, the animation shows the physics of the quake, said Andy Frassetto, a project associate at IRIS. When an earthquake occurs, it sends energy out in all directions, and the signature of that energy can reveal how the fault moved. In the case of the Gulf of California quakes, the ripples are offset along a line that cuts through the Midwest, revealing the orientation of the fault line and the direction of the quake's movement.
"You almost never see that in data," Frassetto told LiveScience.
The waves, much too gentle to be felt, travel across the country over the course of about 20 minutes.
Next stop: Alaska
IRIS and EarthScope researchers now plan an effort perhaps more ambitious than their sonogram of the continental United States: Next, the array is moving to Alaska.
"It was hard enough for the crews to put something every 70 kilometers across the entire continental United States," Taber said. "Now, to go to Alaska and try to do the same thing — not quite as dense, but almost as dense, in Alaska conditions — is going to be another game." [7 Ways the Earth Changes in the Blink of an Eye]
Seismic stations and crews will be flown in via fixed-wing planes and helicopter, Taber said. The results from the Alaskan observations will help researchers understand how the region formed and improve their understanding of Alaskan earthquakes. The largest earthquake ever recorded in the United States, a magnitude 9.2, occurred at Prince William Sound in Alaska in 1964.
Follow Stephanie Pappas on Twitter and Google+. Follow us @livescience, Facebook & Google+. Original article on LiveScience.

Stephanie Pappas is a contributing writer for Live Science, covering topics ranging from geoscience to archaeology to the human brain and behavior. She was previously a senior writer for Live Science but is now a freelancer based in Denver, Colorado, and regularly contributes to Scientific American and The Monitor, the monthly magazine of the American Psychological Association. Stephanie received a bachelor's degree in psychology from the University of South Carolina and a graduate certificate in science communication from the University of California, Santa Cruz.