


How many people are in the world?
You may think of the global population as a massive, exponentially-growing number of people that threaten to use up all of the world's resources, but that's not the case.

There are approximately 7.8 billion people in the world as of July 2020, according to a 2020 report published in the journal The Lancet.
The global population is an estimate of the total number of people living on the planet, rather than a true running total of every baby born minus every person who has died at a given moment in time.
Because it's impossible to keep track of the real-time numbers of births and deaths worldwide, demographers, or statisticians that study human populations, calculate the world's population by adding up estimates of regional populations, according to the United Nations. They arrive at these regional estimates by taking into account a variety of factors, including fertility rate, or the average number of children that a woman has in her lifetime, and mortality rate, or a person's life expectancy, given the social and economic conditions of the region.
The world's population has grown rapidly in the last two centuries, driven largely by an increase in the number of people surviving to reproductive age as quality of life and healthcare have improved in almost every country around the world over this time. However, ever since peaking in the 1970's, the global population growth rate has slowed, according to a 1993 report published in the journal Population Today.
The world's population reached 1 billion a little more than 200 years ago, in 1800, according to Our World in Data, an open-source database and charity based in England and Wales. The rate of growth quickly accelerated in the years that followed. The next billion came a little over one century later, in 1927. The global population hit 3 billion in 1959, 4 billion in 1975, 5 billion in 1987 and 6 billion in 1999, according to the United Nations. There were an estimated 7 billion people in the world as of Oct. 31, 2011 and that number is projected to reach 8 billion in 2023, 9 billion in 2037 and 10 billion by 2057, according to the same United Nations data.
The U.N. projects that the world's population will reach about 11 billion by 2100, though long-term future projections are subject to change. In 2019, a report published by the United Nations predicted that the global population annual growth rate would fall to less than 0.1% by 2100, due to a decreasing number of children born worldwide.
Related: Why global population growth will grind to a halt by 2100
Get the world’s most fascinating discoveries delivered straight to your inbox.
Over the last 50 years, the composition of the world population, or the number of people in various demographic categories such as nationality, ethnicity and age, has changed because the nature of population growth isn't uniform across the regions of the world. Populations in certain areas are growing more quickly than others due to differences in fertility and mortality rates, as well as differing patterns of migration.
In general, demographers have identified four demographic "mega-trends" that can help explain these changes in the composition of the global population: overall population growth, aging, increasing international migration and urbanization. These are overarching themes that broadly point to how and why the global population will change in the coming years.

The history of global population growth over time
For the vast majority of human history, the global population grew relatively slowly. Historical demographers have estimated that about 4 million people lived on Earth in 10,000 B.C., according to Our World in Data. That number grew to about 190 million people at the dawn of the first millennia, at A.D. 0. The population continued to rise from then on, though it might have either stayed the same or declined during the Black Death, when the Bubonic Plague struck Europe and killed between 33% and 55% of the population in the 1300s.
The average annual population growth rate was 0.04% annually from 10,000 B.C. to A.D. 1700, according to Our World in Data. By 1800, there were approximately 1 billion people living in the world, per the same source. The Industrial Revolution at the turn of the century spurred an acceleration in the global population growth rate that lasted for the next 100 years, leading up to the world's two-billionth human being born in 1927.
From 1920 to 1950, the population growth rate averaged around 1% a year, according to Our World in Data. By the middle of the century, advances in public health, especially the discovery of antibiotics, increased the average life expectancy, and the number of people on the planet surged.
Thirty-three years after the global population hit 2 billion, in 1960, the global population hit 3 billion. The growth rate during the last half of the 1960s hit an all-time peak, averaging 2.04% a year, according to a 1998 study published in the journal Medicine & Global Survival.
Population growth exploded in the later half of the 20th century due to a number of reasons, including a widespread decline in mortality, especially among children, said Sara Hertog, a demographer with the United Nations. "And of course, improved survival of children means more adults a couple of decades later who have more children for the next generation," Hertog told Live Science. "Also, the post-war baby boom [beginning in late 1940s] led to population growth in North America and Europe in particular."
By the 1970s, the popularization of contraception helped slow population growth once again. But because so many humans were already on the planet, a so-called "population explosion" was beginning to take place, and the global population reached 4 billion in 1974. In 1987, just 13 years later, there were 5 billion people. And just 12 years after that, in 1999, there were 6 billion. Another 12 years later, in 2011, there were 7 billion, and it's projected that it will take another 12 years to reach 8 billion in 2023, according to United Nations’ estimates.
However, the rate of global population growth has slowed considerably since the population explosion of the 1970s. It's currently about 1.05% as of 2020, according to Worldometer, an independent open-source database. The growth rate was 1.08% in 2019, 1.10% in 2018, and 1.12% in 2017, according to Worldometer, which uses United Nations’ population data for these calculations.
Breaking global population growth down by region shows that the declining growth rate trend is not taking place everywhere. For example, the population growth rate is about 2.7% in Sub-Saharan Africa as of 2020, according to the Economist. This is where demographers expect over half of the world's population to grow over the next century, largely due to high fertility rates and decreasing mortality rates there.
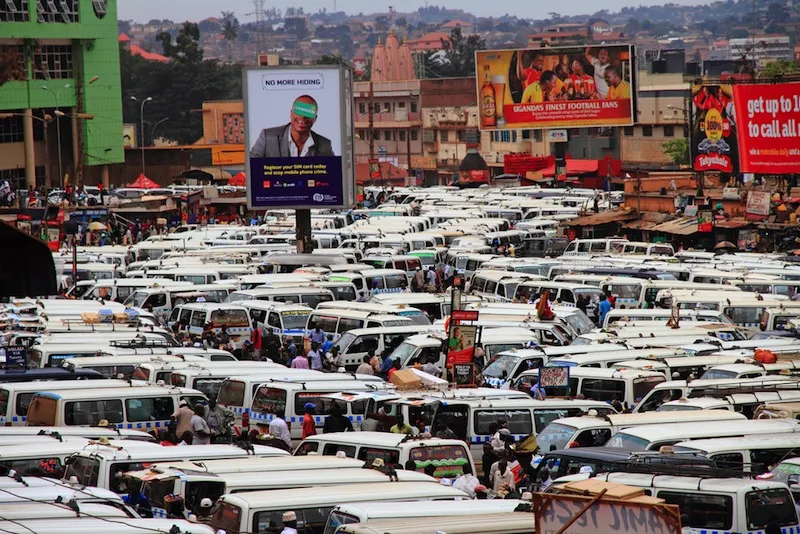
Taxis crowded downtown in Kampala, Uganda. According to 2017 data from the UN, Uganda has recently had the highest non-immigration population growth rate thanks to high fertility rates and decreasing mortality.
The fertility rate and global population
The fertility rate is one of the most important numbers that's used to estimate the global population. The total fertility rate of a population is the average number of offspring per woman and because it's an average, it's calculated to the tenth decimal point. If the fertility rate increases while other factors for population remain the same, the population will grow.
A fertility rate of 2.1 children per woman is known as the replacement fertility rate. It means that a population will neither decline nor grow. This is because on average, if women each give birth to 2.1 children that survive to at least age 15, these children will replace the mother and her partner in the next generation, according to the encyclopedia Britannica.
The global average fertility rate is 2.5 as of 2015, according to the United Nations. (This is a significant decrease from an average of 3.2 births per woman in 1990.) But fertility rates around the world vary widely depending on the specific region. The total fertility rate in Sub-Saharan Africa is 4.6, for example, while in North America and Europe it's 1.7.
Related: US birth rate hits all-time low: What's behind the decline?
"There are a number of factors that influence the fertility rate of a given country," Hertog said. "Most notably, the level of human development and the women's access to education and employment opportunities, and access to information and resources for family planning that enables them to decide on the timing and number of their children."
Several studies have shown that when women and girls have the same educational opportunities as their male peers, women have more opportunities later in life and tend to have fewer children. This could be due to the fact that women may choose to delay having children when they pursue education and gainful employment.
In addition, urbanization tends to lead to lower fertility rates. Urban areas typically undergo a "demographic transition" — a shift from high birth and death rates, to low birth and death rates.
However, lower birth and death rates in urban areas isn't a guarantee, "given that the quality of healthcare and sanitation is not universally better in urban areas, specifically, for example, in slum conditions," Hertog said. "But one thing that happens in urban areas that affects fertility and thus, population growth, is that women tend to have more access to education, employment opportunities and reproductive healthcare."

Children walking to school in Madagascar. When women and girls have the same educational opportunities as their male peers, women have more opportunities later in life and tend to have fewer children.
Mortality and the global population
Mortality refers to the measure of the number of deaths in a population. This data is usually obtained from countries’ death registers.
It can be difficult for demographers to get an exact number of deaths in a population over a given time, because not every country maintains national birth and death databases or conducts a census registering all births and deaths. If this is the case, demographers can estimate the number of deaths in a population based on surveys. They use this number along with factors such as life expectancy and other demographic factors including gender to calculate the rate of mortality. (Life expectancy is estimated based on poverty rates, health quality, especially prevalence of infectious diseases, for a given year.)
According to Our World in Data, historical demographers have estimated that life expectancy was around 30 years in all regions of the world before industrialization, which began in Europe around 1800. There were high rates of infant and youth (those under the age of 15) mortality, with about 27% of all children dying before the age of 1 and about 47% of all children dying before the age of 15, according to a 2013 study published in the journal Evolution and Human Behavior. The global fertility rate was 5.77, according to economist Mattias Lindgren at global development foundation Gapminder, though the rate ranged by country. In the United States, it was 7, while in Norway, it was 4.3.
But infant, youth and adult mortality have decreased around the world, bringing the life expectancy up, largely due to advances in food production, medicine and sanitation, according to a 2013 report published in The Lancet.
The average global life expectancy improved from 46.5 years between 1950 - 1955 to 65 years between 1995 - 2000, according to the World Health Organization. As of 2019, the United Nations estimated a global average life expectancy of 72.6 years.
Still, life expectancy varies around the world. Global life expectancy in 2016 was 72 years on average, but that ranged from about 61.2 years throughout Africa to 77.5 years in Europe, according to the World Health Organization.
Studies have shown that there is a correlation between a low standard of living, which accompanies higher levels of poverty, and lower life expectancies. In addition, major events such as wars, natural disasters, famines and pandemics can have a significant impact on the overall mortality of a population.
How demographers find data to reach these calculations
Demographers rely upon countries' vital statistics and censuses to gather data on the number of births, deaths, emigration and immigration that take place within each country. However, not all countries keep these records, and even when they do, the records aren't always accurate. Many developing countries, countries that are experiencing conflicts or areas where natural disasters have caused mass human displacement do not have available data.
If country-wide data are not available demographers rely on household surveys, Hertog said. These surveys sample a representative number of households in a country. An interviewer visits each of those households and interviews household members, asking key questions about their characteristics such as age of household members, education level, income, household situation and births and deaths in their family.
Related: How do you count seven million people?
Demographers will then use the data collected in their surveys to extrapolate fertility and mortality for the country's population. This data goes into making the projections of the global population in the coming years.

The United States has had a federal census office since 1840. Now, the census is taken every 10 years and used to determine the demographics of the country as well as reapportion seats in the House of Representatives.
Projections of the future global population
Population projections attempt to show how many people will live on the planet in the near future and in the long-term. The projections of future global populations are not definite, given that the conditions determining how many children will be born and how many people will die are constantly changing.
Related: What 11 billion people means for the planet
A 2019 United Nations report found that nine countries will contribute more than half of all projected global population growth by 2050: India, Nigeria, Pakistan, the Democratic Republic of the Congo, Ethiopia, the United Republic of Tanzania, Indonesia, Egypt and the U.S. (in descending order of projected growth).
Having accurate projections of the global population is important for understanding how people will use the finite resources of the planet. In addition, understanding the population distribution is crucial to understand how to best allocate resources.
For example, predicting how many children will be born, and where, can help determine where resources for healthcare and education should be directed. And predicting the number of people entering an area's workforce can help countries figure out how to establish the most efficient labor markets.
Additional resources:
- Compare where people live around the globe in this data visualization of different countries' populations, from the Visual Capitalist.
- Learn more about the implications of a shrinking global population, from The Atlantic.
- Dive deeper into what global fertility rates are and how they are changing, from The Conversation UK.
Holly Secon is a freelance science writer based in California. She has worked as a science writing fellow at Business Insider, and was an associate editor at GreenBiz. Previously, she worked in communications at Twitter and at the National Writing Project. She holds a bachelor's degree in Media Studies from UC Berkeley.