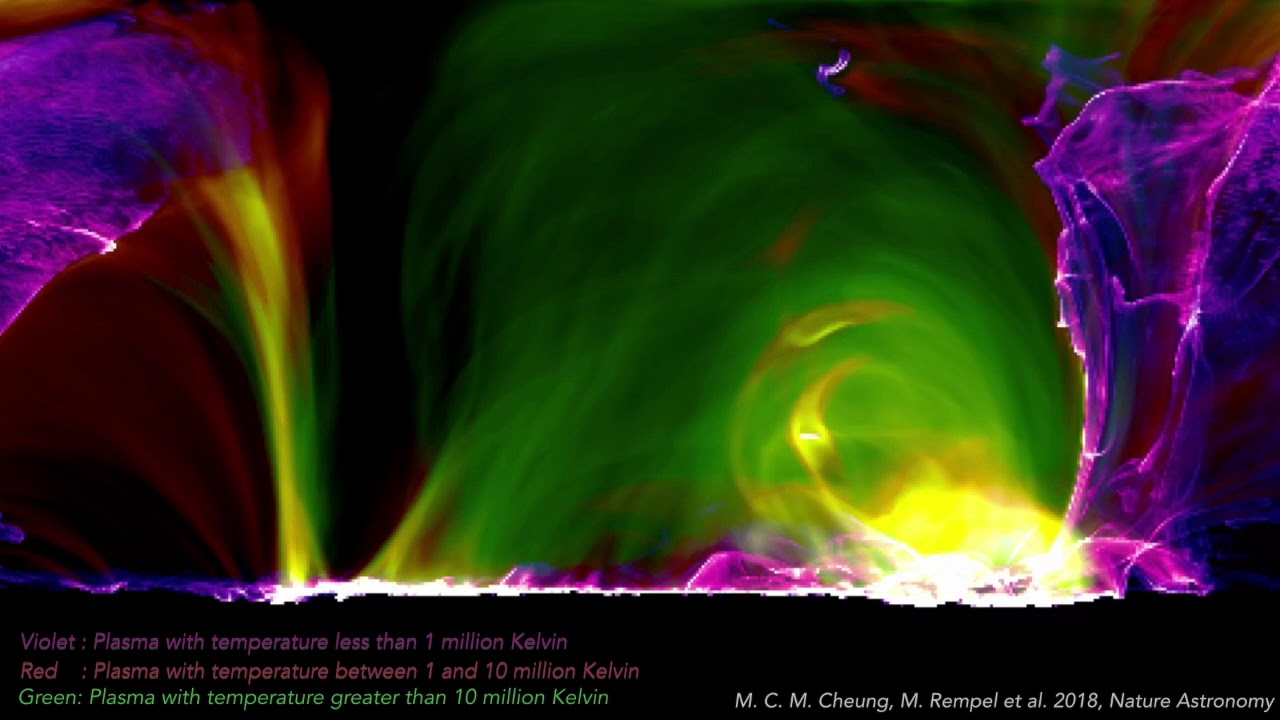
A dazzling new animation captures the life cycle of a solar flare in 3D, using vivid colors to represent the varying temperatures in the fiery eruption.
The intriguing animated snapshot shows the flare from formation to finale, with dancing, illuminated tendrils of magnetic field lines that surge and then finally subside in a brilliant burst of explosive energy.
But the gorgeous animation isn't just eye candy. It’s drawn from a model that lays important groundwork for predicting flares generated by solar weather. Long term, scientists could produce accurate animations in real time, researchers reported in a new study. [The Sun's Wrath: Worst Solar Storms in History]
Latest Videos From
Solar flares are the most powerful explosions in our solar system, and they are spectacular events. They form near sunspots — dark patches on the sun's surface that are cooler than the churning plasma around them. Sunspots are produced by strong magnetic forces nearby, according to NASA.
When energy builds up and is suddenly released on the solar surface, it produces a flare, which appears as looping strands of magnetic energy.
To model a flare from beginning to end, the researchers needed to calculate the forces within all the areas of the sun that shape solar flares. The model's data plunged more than 6,000 miles (10,000 kilometers) under the solar surface, where flares form, and extended nearly 25,000 miles (40,000 km) above the sun's surface and into the corona, the researchers reported.
Once they had constructed a sun simulation, they stirred their solar ingredients to see if the model would produce a flare — and it did.
"Our model was able to capture the entire process, from the buildup of energy to emergence at the surface to rising into the corona, energizing the corona, and then getting to the point when the energy is released in a solar flare," study co-author Matthias Rempel, a senior scientist with the National Center for Atmospheric Research in Boulder, Colorado, said in a statement.
Though solar flares take place about 93 million miles (149 million km) from Earth, they can have dramatic impacts on the planet. Flares sometimes accompany powerful solar storms that hurl enormous quantities of stored magnetic energy at Earth. When this energy slams into Earth's geomagnetic field, it generates surges that can affect communications networks, electrical power grids and satellite technology.
Energy waves from solar storms can also cause electrical fluctuations that disrupt the migration of animals such as whales, which navigate using Earth's magnetic field.
The findings were published online Nov. 26, 2018, in the journal Nature Astronomy.
Originally published on Live Science.