A NASA-built instrument aboard an international satellite has made its first global map of the saltiness of Earth's seas, just three months after the high-tech sensor rocketed into orbit.
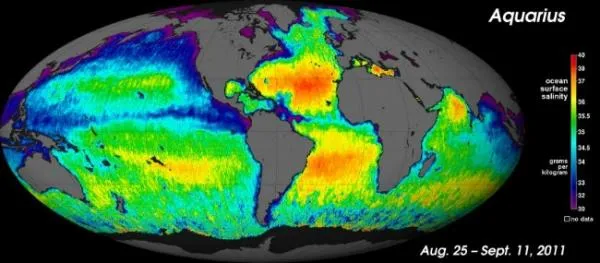
On the colorful map, yellow and red represent areas of higher salinity (or salt content), with blues and purples indicating areas of lower salinity. Areas colored black are gaps in the data.
Known as Aquarius, the instrument is making NASA's first space observations of salinity variations on the ocean surface a key component of Earth's climate that influences ocean circulation and is linked to the cycling of freshwater around the planet.
Latest Videos From
So far, the instrument is performing better than NASA scientists expected. The new map was made from Aquarius's first two-and-a-half weeks of data.
The instrument was blasted into space on June 10, 2011, and became operational on Aug. 25.
The new Aquarius map reveals predominantly well-known ocean salinity features, such as higher salinity in the subtropics, higher average salinity in the Atlantic compared with the Pacific and Indian oceans, and lower salinity in rainy belts near the equator, the northernmost Pacific Ocean and elsewhere.
These features are related to large-scale patterns of rainfall and evaporation over the ocean, river outflow and ocean circulation. Aquarius is built to monitor how these features change over time, and study their link to climate and weather variations.
In addition to large-scale patterns, the map shows detailed regional contrasts in surface-water salt levels, such as a surprisingly large area of low salinity associated with water flowing out of the Amazon River .
Although the instrument has performed admirably, the early data do contain some uncertainties, and there is much work to be done to calibrate and validate the information.
For example, high winds and low surface temperatures have meant that salt measurements in the southernmost oceans aren't yet reliable but scientists have plenty of time to fine-tune their data.
Aquarius is slated to map salinity in the open ocean once every seven days for at least three years.
Follow OurAmazingPlanet for the latest in Earth science and exploration news on Twitter @OAPlanet and on Facebook.

 Live Science Plus