It's quick and easy to access Live Science Plus, simply enter your email below. We'll send you a confirmation and sign you up for our daily newsletter, keeping you up to date with the latest science news.
In 1953, a young scientist named Charles David Keeling began to measure the amount of carbon dioxide (CO2) in the atmosphere around Pasadena, Calif.
Soon, Keeling expanded his CO2 research to areas as diverse as Big Sur, near Monterey, Calif.; the Olympic Peninsula in Washington; and the mountains of Arizona.
But everywhere he went, an interesting pattern emerged: CO2 levels increased at night, and leveled off at about 310 parts per million (ppm) in the afternoon. [8 Ways Global Warming Is Already Changing the World]
Keeling soon realized that the nightly increase was largely due to localized respiration from plants. After word of Keeling's research spread, he was invited to expand his network of CO2 monitoring stations to places like the Mauna Loa Observatory in Hawaii, and Antarctica.
As his monitoring stations gathered data, Keeling once again discovered something that had eluded scientists: the seasonal rhythm of CO2 levels.
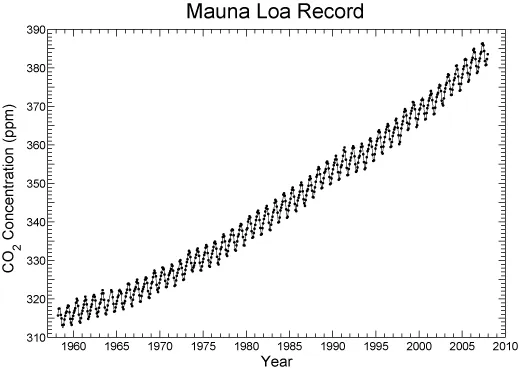
In 1958 at Mauna Loa, Keeling observed that CO2 levels peaked in May, and then dropped to a low in October; the May/October pattern was repeated in 1959.
"We were witnessing for the first time nature's withdrawing CO2 from the air for plant growth during summer and returning it each succeeding winter," Keeling was quoted as saying by the Scripps Institution of Oceanography.
Sign up for the Live Science daily newsletter now
Get the world’s most fascinating discoveries delivered straight to your inbox.
But Keeling also discovered something more profound: Year after year, the amount of CO2 in the atmosphere was gradually increasing due to the combustion of fossil fuels.
Of even greater concern to Keeling was his discovery that the rate of increase was sharper each successive year, giving Keeling's CO2 chart a distinctive upward curve, now called the "Keeling Curve."
Keeling's record of data from Mauna Loa is considered one of the best and most consistent climate records anywhere, though scientists also use other sources for atmospheric data, including samples of air trapped in polar ice, to analyze CO2 levels in past millennia.
And when the Keeling Curve is added to atmospheric research from the past, it shows a trend that has alarmed scientists worldwide: CO2 levels are rising at a dramatic pitch, one unseen in the entire geologic record.
The rate at which atmospheric carbon dioxide levels are increasing is unprecedented.
(Image credit: Scripps Institution of Oceanography)
Levels of CO2 will soon reach heights of 400 ppm and higher — levels not seen in millions of years, with unknown consequences for the planet.
According to the CO2 Program at the Scripps Institution, "Unless serious efforts are made to reduce the dependence on fossil fuels, it is clear that we are on a threshold of a new era of geologic history — one with climate very different from that of our ancestors."
Though David Keeling passed away in 2005, his son Ralph continues his father's CO2 research efforts at the Scripps Institution.
Marc Lallanilla has been a science writer and health editor at About.com and a producer with ABCNews.com. His freelance writing has appeared in the Los Angeles Times and TheWeek.com. Marc has a Master's degree in environmental planning from the University of California, Berkeley, and an undergraduate degree from the University of Texas at Austin.