Who Has Been Getting Snow This Winter?
Get the world’s most fascinating discoveries delivered straight to your inbox.
You are now subscribed
Your newsletter sign-up was successful
Want to add more newsletters?
Delivered Daily
Daily Newsletter
Sign up for the latest discoveries, groundbreaking research and fascinating breakthroughs that impact you and the wider world direct to your inbox.
Once a week
Life's Little Mysteries
Feed your curiosity with an exclusive mystery every week, solved with science and delivered direct to your inbox before it's seen anywhere else.
Once a week
How It Works
Sign up to our free science & technology newsletter for your weekly fix of fascinating articles, quick quizzes, amazing images, and more
Delivered daily
Space.com Newsletter
Breaking space news, the latest updates on rocket launches, skywatching events and more!
Once a month
Watch This Space
Sign up to our monthly entertainment newsletter to keep up with all our coverage of the latest sci-fi and space movies, tv shows, games and books.
Once a week
Night Sky This Week
Discover this week's must-see night sky events, moon phases, and stunning astrophotos. Sign up for our skywatching newsletter and explore the universe with us!
Join the club
Get full access to premium articles, exclusive features and a growing list of member rewards.
This article was provided by AccuWeather.com.
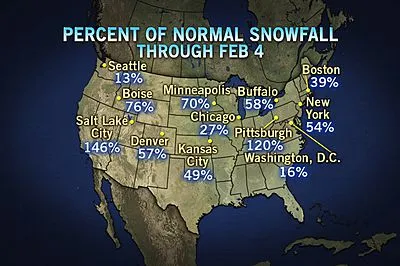
While the winter of 2012-2013 is well short of normal snowfall for many cities, there are some locations that are above the normal mark. There is still with more winter and snow to go.
Despite the abysmal snowfall numbers in some areas, many areas are ahead of least year in terms of snowfall.
Snowfall has and may continue to be lean along the I-95 corridor, in a pocket of the Midwest centered on Chicago and along the coastal areas of the Northwest.
In a typical winter, the I-95 zone does not receive a tremendous amount of snow, but it can achieve their average by way of one big storm. The same is true for a number of locations in the coastal Northwest, the Tennessee Valley and interior South.
Along the East coast, there has been a lack of cold storms tracking northward just offshore. In the coastal Northwest, there has been very limited arctic air around when frequent storms have visited the region.
As for the area from St. Louis to Chicago in the Midwest, most storms have been tracking to their west, east, north and south, leaving a doughnut hole in the middle.
Get the world’s most fascinating discoveries delivered straight to your inbox.
There have been some locations that have done well for snow at this point in the season. These include many areas in the Appalachians, parts of the Great Basin and the interior South Central states.
The table below compares snowfall for this season so far to normal and all of last winter's (all in inches). In terms of snowfall, locations in white are above-average, locations in red are well below-average and locations in black are relatively close to normal. Amounts for the passes in the Cascades and Sierra Nevada are estimated and will not accurately reflect the season-to-date amounts until the end of the season. *(For these same passes, the normal snowfall for the entire season is used, instead through Feb. 3.)
| City | Feb. 3 Normal | This Winter to Feb. 3 | All Last Winter | Header Cell - Column 4 | City | Feb. 3 Normal | This Winter to Feb. 3 | All Last Winter |
|---|---|---|---|---|---|---|---|---|
| Caribou, Maine | 63.0 | 43.6 | 96.2 | Row 0 - Cell 4 | Boston, Mass. | 24.4 | 9.4 | 9.3 |
| Syracuse, N.Y. | 79.6 | 58.7 | 51.0 | Row 1 - Cell 4 | Buffalo, N.Y. | 63.7 | 36.9 | 36.0 |
| Burlington, Vt. | 46.2 | 49.3 | 40.0 | Row 2 - Cell 4 | Detroit, Mich. | 24.8 | 25.2 | 26.0 |
| New York, N.Y. | 13.0 | 7.0 | 7.4 | Row 3 - Cell 4 | Philadelphia, Pa. | 11.3 | 5.1 | 4.0 |
| Pittsburgh, Pa. | 23.7 | 30.4 | 37.0 | Row 4 - Cell 4 | State College, Pa. | 24.1 | 24.2 | 21.0 |
| Washington, D.C. | 9.1 | 1.5 | 2.1 | Row 5 - Cell 4 | Elkins, W.Va. | 49.0 | 46.7 | 41.0 |
| Atlantic City, N.J. | 9.2 | 8.2 | 4.3 | Row 6 - Cell 4 | Norfolk, Va. | 3.8 | 1.6 | 0.5 |
| Bristol, Tenn. | 7.8 | 7.3 | 1.2 | Row 7 - Cell 4 | Cincinnati, Ohio | 13.0 | 11.5 | 5.5 |
| Atlanta, Ga. | 1.8 | Trace | 0 | Row 8 - Cell 4 | Nashville, Tenn. | 3.5 | 0.5 | 0.3 |
| Cleveland, Ohio | 39.0 | 28.4 | 39.0 | Row 9 - Cell 4 | Chicago, Ill. | 21.9 | 6.0 | 20.0 |
| Charlotte, N.C. | 2.7 | Trace | 0 | Row 10 - Cell 4 | Roanoke, Va. | 10.4 | 5.7 | 6.1 |
| Birmingham, Ala. | 0.7 | 2.1 | Trace | Row 11 - Cell 4 | Jackson, Miss. | 0.6 | 1.7 | Trace |
| Indianapolis, Ind. | 17.4 | 17.9 | 10 | Row 12 - Cell 4 | Des Moines, Iowa | 21.0 | 24.1 | 21 |
| Omaha, Neb. | 15.8 | 12.1 | 20 | Row 13 - Cell 4 | Minneapolis, Minn. | 34.4 | 24.1 | 22 |
| Fargo, N.D. | 31.7 | 24.7 | 27 | Row 14 - Cell 4 | Huron, S.D. | 24.4 | 20.9 | 31 |
| Kansas City, Mo. | 11.4 | 5.6 | 0.4 | Row 15 - Cell 4 | St. Louis, Mo. | 11.3 | 9.0 | 6 |
| Denver, Colo. | 29.7 | 17.0 | 55 | Row 16 - Cell 4 | Rapid City, S.D. | 17.9 | 17.3 | 25 |
| Dodge City, Kan. | 11.7 | 9.1 | 8 | Row 17 - Cell 4 | Oklahoma City, Okla. | 5.6 | 1.4 | 1.8 |
| Dallas, Texas | 0.7 | 0.8 | 0.3 | Row 18 - Cell 4 | Little Rock, Ark. | 2.0 | 10.6 | 2.2 |
| Great Falls, Mont. | 30.6 | 46.0 | 30 | Row 19 - Cell 4 | Spokane, Wash. | 34.4 | 38.2 | 36 |
| Pocatello, Idaho | 27.6 | 26.1 | 15 | Row 20 - Cell 4 | Cheyenne, Wyo. | 28.1 | 28.7 | 51 |
| El Paso, Texas | 5.4 | 3.1 | 3.2 | Row 21 - Cell 4 | Salt Lake City, Utah | 35.9 | 52.4 | 24 |
| Boise, Idaho | 15.2 | 1.5 | 8.1 | Row 22 - Cell 4 | Seattle, Wash. | 4.5 | 0.6 | 11 |
| Portland, Ore. | 2.2 | Trace< | 0 | Row 23 - Cell 4 | Amarillo, Texas | 12.9 | 4.0 | 12.5 |
| Flagstaff, Ariz. | 54.7 | 33.6 | 97 | Row 24 - Cell 4 | Reno, Nev. | 14.3 | 9.3 | 8 |
| Gallup, N.M. | 20.1 | 8.7 | 11 | Row 25 - Cell 4 | Aspen, Colo. | 95.3 | 57.4 | 58.1 |
| Lake Tahoe, Calif. | 125* | 57.4 Est. | 72 | Row 26 - Cell 4 | Stampede Pass, Wash. | 439* | 73.5 Est. | 348 |
Meteorologist Brian Edwards has a look at just how cold (or not) this January was.
AccuWeather.com. All rights reserved. More from AccuWeather.com.
The weather is getting stranger, right? Well, for the most part no, scientists say, but humans often think so when a strange event does occur. So here’s your chance to prove how much you known about weather oddities.
Weird Weather: One Strange Quiz
