It's quick and easy to access Live Science Plus, simply enter your email below. We'll send you a confirmation and sign you up for our daily newsletter, keeping you up to date with the latest science news.
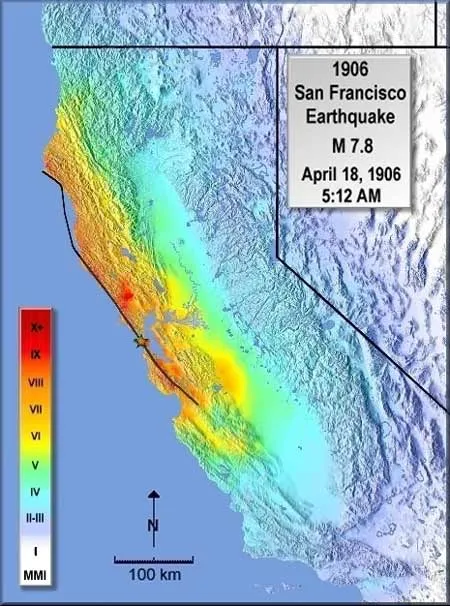
The great San Francisco earthquake of 1906 was the deadliest in U.S. history. A new map of the event, based in part on crumbled tombstones, shows in detail the extent of ground rumbling and provides lessons for future events.
On the morning of April 18, 1906, an earthquake of approximate magnitude 7.8 erupted, with an epicenter near the where the Golden Gate Bridge would later be built. It was felt 400 miles away in Los Angeles and in Winnemucca, Nevada. Damage was heavy in the farming community of Ferndale, Calif., 200 miles to the North.
"Many of our most solid and substantial buildings have been reduced to almost a wreck," was the report in the April 20, 1906 edition of The Ferndale Enterprise.
The impact was greatest in San Francisco where a fire, triggered by the quake, ravaged much of the city. More than 3,000 people died, and damage exceeded 400 million dollars.
Model for the present
Much scientific investigation followed. Geologists witnessed for the first time large ground slips all along the 300-mile-long rupture. Theories were devised to explain these horizontal shifts.
"Our present model for what causes earthquakes came out of the 1906 earthquake," geologist John Boatwright told LiveScience.
Sign up for the Live Science daily newsletter now
Get the world’s most fascinating discoveries delivered straight to your inbox.
Continuing with this legacy, Boatwright and Howard Bundock, both from the U.S. Geological Survey (USGS), have re-analyzed the old data and added more numbers to create a detailed map of the 1906 event. The ShakeMap, as it is called, will give earthquake researchers a template for refining their models of big earthquakes.
"This ShakeMap graphically points out that great earthquakes like 1906 behave in ways that are very different than a smaller magnitude event," Boatwright said.
Subjective measure
ShakeMap is a relatively new tool for characterizing the intensity of an earthquake. Intensity is a qualitative measure of the amount of shaking at a particular point on the Earth's surface. It is separate from the magnitude, which is an overall measure of an earthquake's energy.
Intensity is usually based on subjective experience.
The USGS mails out questionnaires or has people fill out a web survey to determine the shaking that was felt in a particular area. A full intensity assessment can take a long time to compile.
The ShakeMap, however, takes only a few minutes. It involves computer models that use data from modern seismic networks to generate the expected intensity. For earthquakes greater than magnitude 3.5, a ShakeMap is immediately sent out to first responders and earthquake scientists.
1906 vs. Loma Prieta
For the 1906 earthquake, Boatwright and Bundock have basically done a ShakeMap in reverse. Since there is very little instrument data from back then, the researchers "retrofit" the map software to incorporate historical accounts, newspaper clippings and a new analysis of damage to tombstones of the time.
This new look at the 99-year-old event makes it clear that the intensity of a great earthquake cannot be predicted by simply turning up the magnitude of a smaller earthquake - like the magnitude 7.1 Loma Prieta earthquake that struck in the same vicinity on October 17, 1989 and halted the third game of the World Series.
"If you make the assumption that the 1906 is something like lining up 20 or so Loma Prietas," Boatwright said, "you expect more shaking along the fault than was actually measured."
While places near the fault experienced lower intensities than might be expected, the 1906 ShakeMap also shows that spots away from the fault had slightly higher intensities. Deciphering this distribution of shaking is important for geologists because there is a dearth of good data on strike-slip earthquakes - of which 1906 is one - with magnitudes around 8.
Dead ringer
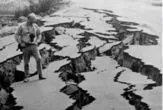
One of the most interesting ways geologists have measured the intensity of the 1906 earthquake is by visiting rural cemeteries.
"What tended to happen is the tombstones broke," explained Boatwright, who made several trips to cemeteries that previous surveyors had overlooked.
If Boatwright saw one or two pre-1906 headstones with damage, he assumed the area had felt an intensity of VII (or 7 in regular numbers) on the Modified Mercalli Intensity Scale. If a quarter to a third of the headstones were broken, the site was given a VIII (8), while anymore than that was a IX (9).
In Bloomfield, Calif., Boatwright was amazed to find three flat-lying footstones that were damaged. He gave that a 9.
Boatwright said he enjoyed this work, but "I'm hoping my cemetery tours are over."
I. Felt only by a very few people. II. Felt in upper floors of buildings. III. Vibrations similar to the passing of a truck. IV. Felt indoors by many, outdoors by few during the day. At night, some awakened. V. Felt by nearly everyone; pendulum clocks may stop. VI. Felt by all, many frightened. Some heavy furniture moved. VII. Slight to moderate damage in ordinary structures. VIII. Damage slight in specially designed structures; fall of chimneys and factory stacks. IX. Damage considerable in specially designed structures; Buildings shifted off foundations. X. Some well-built wooden structures and most masonry structures destroyed. XI. Few, if any (masonry) structures remain standing. Bridges destroyed. Rails bent greatly. XII. Damage total. Lines of sight and level are distorted. Objects thrown into the air.
A more detailed version of this scale can be found here.
Michael Schirber began writing for LiveScience in 2004 when both he and the site were just getting started. He's covered a wide range of topics for LiveScience from the origin of life to the physics of Nascar driving, and he authored a long series of articles about environmental technology. Over the years, he has also written for Science, Physics World, andNew Scientist. More details on his website.