It's quick and easy to access Live Science Plus, simply enter your email below. We'll send you a confirmation and sign you up for our daily newsletter, keeping you up to date with the latest science news.
This year's decidedly un-winter-like winter brought far less snow than normal, as seen in new maps made from NASA satellite data that show the percentage of snow cover over North America.
The lack of snow brings about mixed blessings for spring: spring floods are less likely, but there will also be less snowmelt to fill reservoirs.
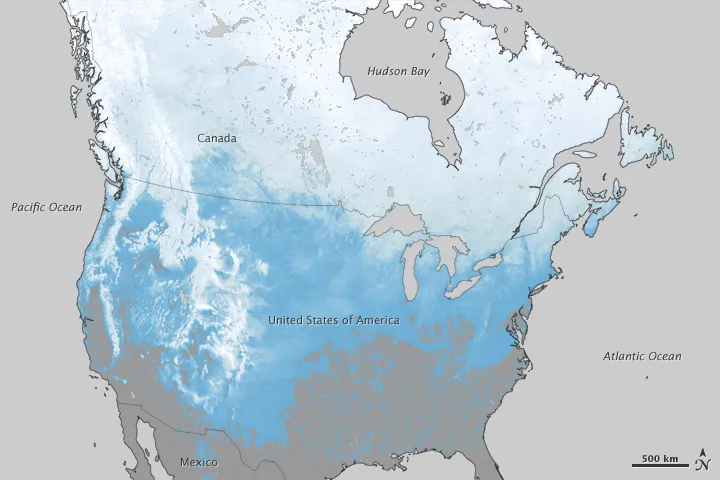
Data from the Moderate Resolution Imaging Spectroradiometer (MODIS) on NASA's Terra satellite was used to make the maps, which show the percentage of days in which a parcel of land was covered by snow this past winter and in the winter of 2010-11.
The deepest blues had snow cover just 10 to 20 percent of the time, while the palest blue depicts near complete snow cover for the season. Gray areas had no measurable snow.
In the winter of 2010-11, the Great Lakes, New England, the Rocky Mountains, and the Basin & Range in the West all received snow over a wider area and for longer periods of time than this past winter, as did Canada’s Alberta, Saskatchewan, and Manitoba provinces.
Most of the eastern half of the United States and southern Ontario had far less snow in 2011-12, and very little reached the South. Snowfall reached deeper into the Southwest, but was short-lived.
This map shows the percentage of days that a particular area had snow in North America from October 1, 2010 - March 21, 2011.
(Image credit: NASA/GSFC)
The overriding patterns in the atmosphere over North America during the winter were the main reason for the snow no-show.
Sign up for the Live Science daily newsletter now
Get the world’s most fascinating discoveries delivered straight to your inbox.
"A major reason for the snow deficits was the persistent position of the jet stream close to the U.S.–Canadian border," climatologist Dave Robinson of Rutgers University said in a NASA statement. "This kept the cold air at bay to the north and permitted mild conditions to persist winter-long across most states. With only infrequent buckling (troughs) in the jet to the south the number and severity of winter storms was reduced — as it is the interaction of different air masses that helps spawn storms."
Information on how much snow has fallen in a given winter in a particular area is important for climatologists and hydrologists in evaluating spring flood risks and how much water will be available in a given watershed for irrigation and drinking.
"Water resource managers need this information so they can plan their reservoir heights," said Dorothy Hall, who leads the NASA team that creates the snow maps.
Forecasters with the National Oceanic and Atmospheric Administration have predicted low flood risks for areas of the country that saw devastating floods in previous years.
"For the first time in four years, no area of the United States faces a high risk of major to record spring flooding, largely due to the limited winter snowfall," NOAA said in a statement.
The agency noted that eight of 11 western states still had reservoir levels at or above the normal capacity — a residual effect of last year's thick snow pack.
For the science geek in everyone, Live Science offers a fascinating window into the natural and technological world, delivering comprehensive and compelling news and analysis on everything from dinosaur discoveries, archaeological finds and amazing animals to health, innovation and wearable technology. We aim to empower and inspire our readers with the tools needed to understand the world and appreciate its everyday awe.