Satellite images reveal just how much cities on the US East Coast are sinking
"Continuous unmitigated subsidence on the U.S. East Coast should cause concern."

Get the world’s most fascinating discoveries delivered straight to your inbox.
You are now subscribed
Your newsletter sign-up was successful
Want to add more newsletters?

Delivered Daily
Daily Newsletter
Sign up for the latest discoveries, groundbreaking research and fascinating breakthroughs that impact you and the wider world direct to your inbox.

Once a week
Life's Little Mysteries
Feed your curiosity with an exclusive mystery every week, solved with science and delivered direct to your inbox before it's seen anywhere else.

Once a week
How It Works
Sign up to our free science & technology newsletter for your weekly fix of fascinating articles, quick quizzes, amazing images, and more

Delivered daily
Space.com Newsletter
Breaking space news, the latest updates on rocket launches, skywatching events and more!

Once a month
Watch This Space
Sign up to our monthly entertainment newsletter to keep up with all our coverage of the latest sci-fi and space movies, tv shows, games and books.

Once a week
Night Sky This Week
Discover this week's must-see night sky events, moon phases, and stunning astrophotos. Sign up for our skywatching newsletter and explore the universe with us!
Join the club
Get full access to premium articles, exclusive features and a growing list of member rewards.
Images collected by numerous satellites have shown that major cities and population centers across the U.S. East Coast are sinking.
Land sinking, or "subsidence," as seen by these satellites, is dangerous because it can undermine the foundations of buildings, potentially causing collapse. It can also damaging roads as well as gas and water lines. When coupled with rising sea levels caused by human-driven climate change, subsidence in coastal regions can increase the risk of flooding and worsen subsequent damage.
Among the particularly hard-hit areas are New York City, Long Island, Baltimore, Virginia Beach, and Norfolk, which are experiencing areas of rapid subsidence next to slower-sinking regions and even stable patches of land. This poses a risk to infrastructure like roads, building foundations, pipelines, rail lines and even airport runways.
The new research from Virginia Tech and the U.S. Geological Survey (USGS) shows that some areas of the U.S. East Coast are sinking as rapidly as 5 millimeters (0.2 inches) per year, a rate of subsidence at the edge of the Atlantic Ocean that outstrips global sea level rise.
"Continuous unmitigated subsidence on the U.S. East Coast should cause concern,” Leonard Ohenhen, research lead author and a graduate student at the Virginia Tech Earth Observation and Innovation Lab, said in a statement. "This is particularly in areas with a high population and property density and a historical complacency toward infrastructure maintenance."
A sinking feeling
Together with Virginia Tech Earth Observation and Innovation Lab Associate Professor Manoochehr Shirzaei, Ohenhen and colleagues collected a huge amount of data from space-based radar satellites to build digital maps of terrain.
They then measured millions of subsidence occurrences over many years, following up by constructing some of the first-ever high-resolution images of sinking land.
Get the world’s most fascinating discoveries delivered straight to your inbox.
The team's maps showed that a large number of U.S. East Coast areas sinking by at least 2 mm (0.08 in) per year. Additionally, the scientists found areas along the mid-Atlantic coast, amounting to over 1,400 square miles (3,626 square kilometers), that are sinking by 5 mm (0.2 in) per year or more. The current rate of global sea-level rise, which is around 4 mm (0.16 in) per year.
"We measured subsidence rates of 2 millimeters per year affecting more than 2 million people and 800,000 properties on the East Coast," Shirzaei said. "We know to some extent that the land is sinking. Through this study, we highlight that sinking of the land is not an intangible threat. It affects you and I and everyone, it may be gradual, but the impacts are real."
Ohenhen pointed out how the problem with the subsidence mapped isn't just that land is sinking, but also that "hotspots" of subsidence are occurring in population hubs and around concentrations of infrastructure.
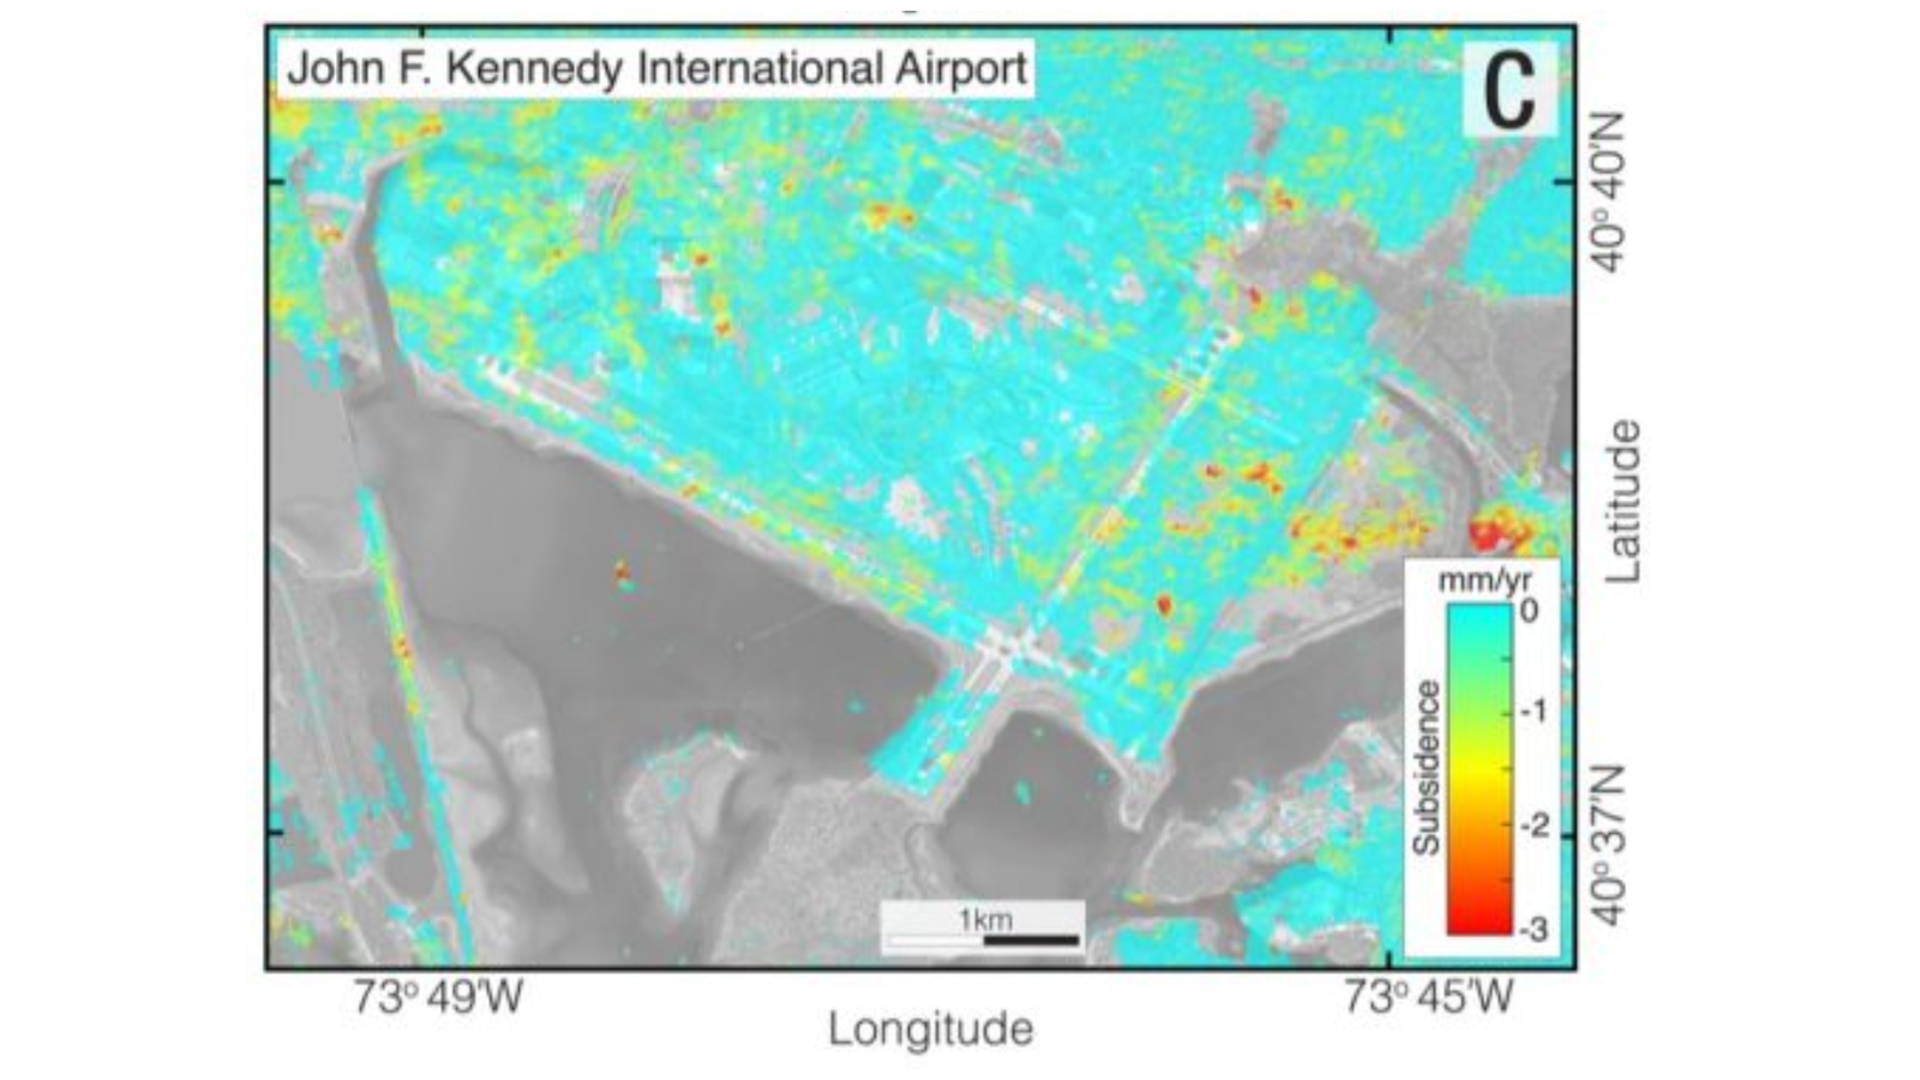
"For example, significant areas of critical infrastructure in New York, including JFK and LaGuardia airports and its runways, along with the railway systems, are affected by subsidence rates exceeding 2 mm per year," he added. "The effects of these right now and into the future are potential damage to infrastructure and increased flood risks."
"This information is needed. No one else is providing it," USGS research geologist and study co-author Patrick Barnard said in the statement. "Shirzaei and his Virginia Tech team stepped into that niche with his technical expertise and are providing something extremely valuable."
The team's research was published on Tuesday (Jan. 2) in the journal Proceedings of the National Academy of Sciences.
Originally posted on Space.com.
Robert Lea is a science journalist in the U.K. who specializes in science, space, physics, astronomy, astrophysics, cosmology, quantum mechanics and technology. Rob's articles have been published in Physics World, New Scientist, Astronomy Magazine, All About Space and ZME Science. He also writes about science communication for Elsevier and the European Journal of Physics. Rob holds a bachelor of science degree in physics and astronomy from the U.K.’s Open University
 Live Science Plus


