
 Live Science Plus


Image Gallery: Mapping the Brain

Mapping the brain
A new map of the human brain during its development in the womb provides a detailed blueprint of where different genes are active at this critical stage of in a fetus' life.
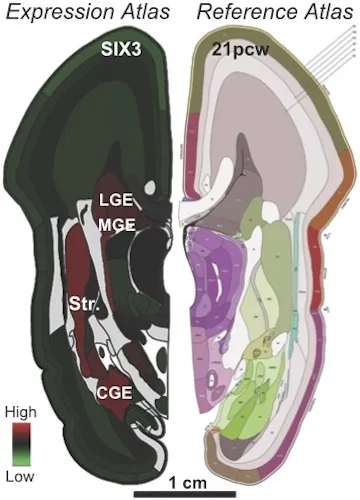
Pictured: Examples from the BrainSpan prenatal expression and reference atlases. Left: SIX3, a gene important for proper formation of the forebrain and eyes, is most highly expressed in a few subcortical areas during prenatal development. Right: The BrainSpan Reference Atlases are full-color, high-resolution, Web-based digital atlases of human brain development in high anatomical detail. Read full story
Fetus brain

This brain atlas yields clues about what makes humans distinct from other animals, and when disorders like autism first take root, researchers say.
Pictured: FOLR1, a receptor utilized for proper folate transport in cortex, is most highly expressed in brain areas of new neuron generation during prenatal development. Read full story
Mouse cortex

In another study, researchers created a map of mouse brain connectivity.
Pictured: A top-down 3-D view of the cortico-connections originating from multiple distinct cortical areas, visualized as virtual tractography using Allen Institute Brain Explorer software.

Mouse brain wiring

A circular wiring diagram of connections among 215 distinct regions throughout the mouse brain. Connections originating from 11 cortical regions are highlighted in different shades of colors, whereas the rest are shown in gray.
Mouse cortex

A high-resolution view of the dense and highly branched axonal projection pattern of the cortico-cortical connections originating from the primary somatosensory cortex.
Mouse vision areas

Connections between four distinct visual areas in the mouse cortex (green, yellow, red, orange) are visualized in 3-D using Allen Institute Brain Explorer software. These cortical areas are highly interconnected with each other and with additional areas involved in vision in the thalamus (pink) and midbrain (purple).
3D human brain

Another project, called BigBrain, created a 3D map of the postmortem brain of a 65-year-old woman, revealing the intricate architecture of the human noggin on a scale finer than a human hair.
Get the world’s most fascinating discoveries delivered straight to your inbox.
3D human brain

A detailed look at the brainstem and cerebellum from the BigBrain project.
Mouse brain

A fluorescent mouse brain, imaged using the CLARITY technique.
