Besides torching forests and houses, wildfires throughout the United States are also releasing a lot of smoke and particulate matter into the air.
A map created using data from a NASA satellite shows the location and amount of pollution wildfires raging across the West have spewed into the skies above the United States.
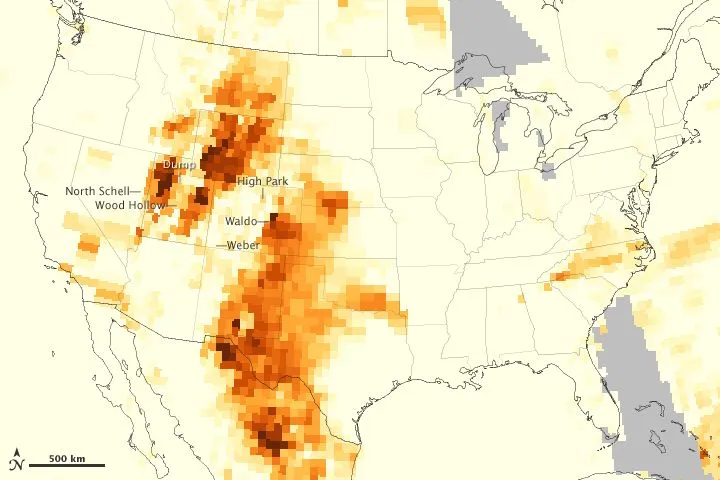
The new map shows relative levels of tiny particles called aerosols, which have an important impact on weather and climate and are unsafe to breathe at certain concentrations. It was created by information gathered by the Suomi National Polar-orbiting Partnership satellite on June 26.
Latest Videos From
The highest concentrations of aerosols appear reddish-brown, while the lowest are light yellow. Heavy concentrations of smoke and aerosols are visible to the northeast of the North Schell, Dump and Wood Hollow fires in Nevada and Utah. Thick smoke plumes from wildfires across Colorado have moved east and south into the plains states. Further south in Texas and New Mexico the map shows particulates from fires there, like the Whitewater-Baldy Complex fire, the largest in New Mexico's history.
The instrument on the satellite that measures aerosols, the Ozone Mapper Profiler Suite, works by analyzing the amount of light scattered and reflected by the atmosphere; smoke and dust reflect much more radiation than clear skies.
Researchers who've analyzed the data used to make the map said that the western wildfires have affected air quality as far away as the East Coast.
Follow OurAmazingPlanet for the latest in Earth science and exploration news on Twitter @OAPlanet. We're also on Facebook and Google+.