Recent reports about how Florida's "stand your ground" law affected the number of deaths in the state have raised a few eyebrows.
The stories have described how, after Florida enacted its self-defense law in 2005, the gun-death rate took a sudden jump. The controversial law — which allows a person to use "deadly force" in self-protection — was a factor in the shooting death of Trayvon Martin by George Zimmerman in 2012.
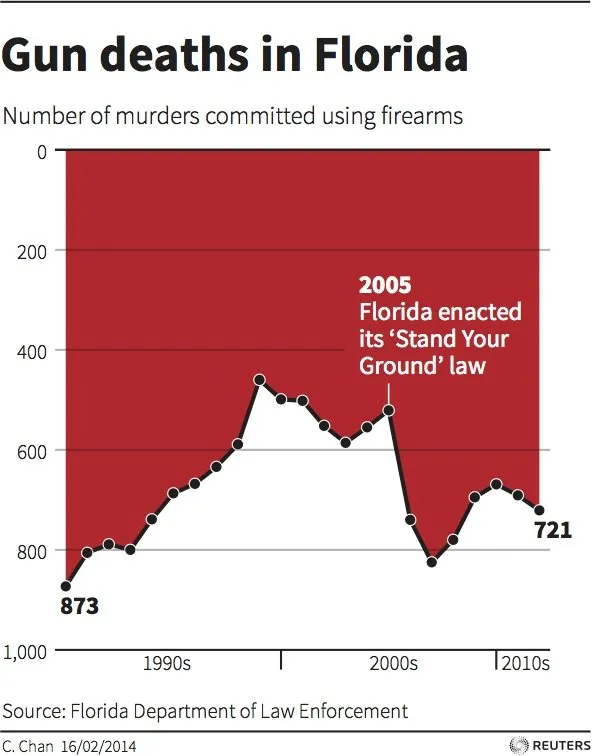
But sharp-eyed observers noticed that a graph accompanying many news reports seemed to suggest that gun deaths actually dropped, rather than jumped, after Florida adopted the law. "It is so deeply misleading that I loathe to expose your eyeballs to it," Lisa Wade, a professor at Occidental College in Los Angeles, wrote in Pacific Standard. [8 Weird Statistics About Daily Life]
When up is down
The problem, Wade and other critics say, is that the vertical y-axis of the graph gets smaller as it goes up, instead of larger, as is the norm when displaying graphical information.
"Most people see a huge falloff in the number of gun deaths after Stand Your Ground was passed," Wade wrote about the graph, developed by Reuters using information from the Florida Department of Law Enforcement. "But that's not what the graph shows."
What the graph actually shows is that in 2005, the rate of gun deaths in Florida was relatively low, at 521. But in 2006 — the year after the law was passed — that number jumped to 740 deaths, and in 2007, there were 825 gun deaths in the state.
"The proper conclusion, then, is that gun deaths skyrocketed after Stand Your Ground was enacted," Wade wrote.
"This is the double edge of novelty in charts," wrote Kaiser Fung on Junk Charts. "There should be a very high bar against running counter to convention. Readers do bring their 'baggage' to the chart, and the designer should take that into consideration."
Showing "deaths in negative terms"
There's no evidence that the graph was intentionally designed to mislead people into believing that gun deaths dropped after Florida's stand-your-ground law went into effect. It does, however, highlight the risks of exercising creative license when presenting information graphically.
The designer of the chart, Christine Chan, explained her decision on her Twitter feed, saying, "I prefer to show deaths in negative terms (inverted). It's a preference really, can be shown either way."
Chan also noted that her inspiration for the chart came from a visually compelling graphic, seen on the website Visualising Data, which displays the death toll from the invasion of Iraq in a disturbing manner, using red "dribble" lines that evoke blood running down a wall. That graph also uses an inverted y-axis.
Lies, damn lies and statistics
Of course, this isn't the first time statistical information has been distorted in its presentation. In 2010, numerous media reports howled that one-third of all teen suicides are among gay and lesbian teenagers.
"Advocates drew upon various studies that suggested that homosexuals attempt suicide at a rate two to three times higher than heterosexuals," wrote Joel Best, professor and chair of sociology and criminal justice at the University of Delaware.
These reports combined "a chain of bad statistics" with faulty assumptions to arrive at the one-third rate of suicide among gay teens, Best said. But it's not an accurate figure, Best added, and nobody knows how the rate of suicide among gay teens compares to the rate among straight teens.
Clarification: This article was updated at 10:15 a.m. ET to include information from Christine Chan's Twitter feed.
Follow Marc Lallanilla on Twitter and Google+. Follow us @livescience, Facebook & Google+. Original article on Live Science.

