Arguing over which snowstorm was the biggest ever is a favorite pastime for weather buffs across the country. Now scientists have developed a new ranking system that could silence those debates.
After storms such as the Groundhog Day blizzard of 2011 , people tend to reflect back on what were the worst snowstorms in memory . Scientists at the U.S. National Oceanic and Atmospheric Administration have developed a way to rank these storms that relies more on several storm characteristics rather than just a single variable. [Related: World's Snow Cover Seen from Space .]
Tornadoes, hurricanes and earthquakes all have scales that measure their intensity, and determining how intense they are is somewhat simple. The intensity is highest around a central point, such as an eye or epicenter, and diminishes as it radiates from there.
Latest Videos From
For winter storms , scientists often compare the minimum central pressure of storms the lower the number, the more intense the storm. But that alone is often not enough to characterize their intensity because these storms are often amorphous, large, and with different intensities throughout.
NOAA's new scale, the Northeast Snowfall Impact Scale (NESIS), ranks the social, economic and transportation impacts of recent winter storms. The scale factors in how large the storm was, how much snow fell and what populations were affected.
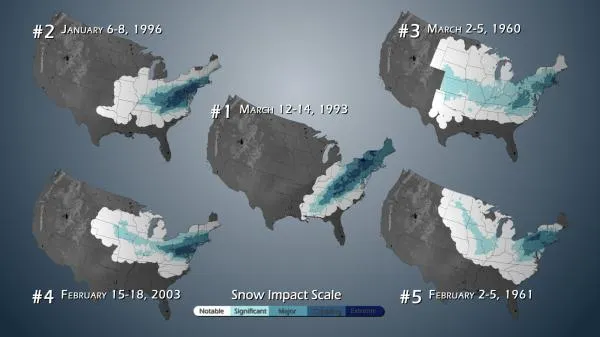
Using a Category 1 to 5 ranking, the top Northeast storms are shown in the above image. The darkest blue areas represent the most affected areas of a storm system.
Interestingly, as large and intense as the recent winter 2010-2011 storms have been, none have made it into the Top 10 list. The Groundhog Day storm is currently ranked at 19.
To have a significant statistical weight, a storm must produce 20 to 30 inches (50 to 75 centimeters) of snow and occur over highly populated areas. Since the Midwest is not as densely populated as the D.C.-through-Boston corridor, storms that peak in the Northeast will typically have a higher intensity on the NESIS Scale.
The Groundhog Day 2011 storm, though severe in many places, did not have a widespread impact on major cities and thus does not match up with the storms of 1993, 1996, 1960, 2003 and 1961.
On the NESIS, the worst storm in U.S. history was the 1993 superstorm that struck the East Coast on March 12 to 14.