


Image Gallery: Slicing Through the Brain
The Human Brain

Researchers have compiled a high-resolution atlas of genetic activity in the adult human brain based on the complete brains of two men as well as a hemisphere from a third man's brain, all of the tissue healthy when the men died. The researchers are making their data freely accessible online to aid in studies of normal and abnormal human brain function.
Tangle of Brain Cells
The main challenge when it comes to understanding the human brain is the fact that it is the most powerful computer known. It consists of approximately 100 billion neurons with roughly 1 quadrillion (1 million billion) connections wiring these cells together, and each connection or synapse typically fires about 10 times per second.
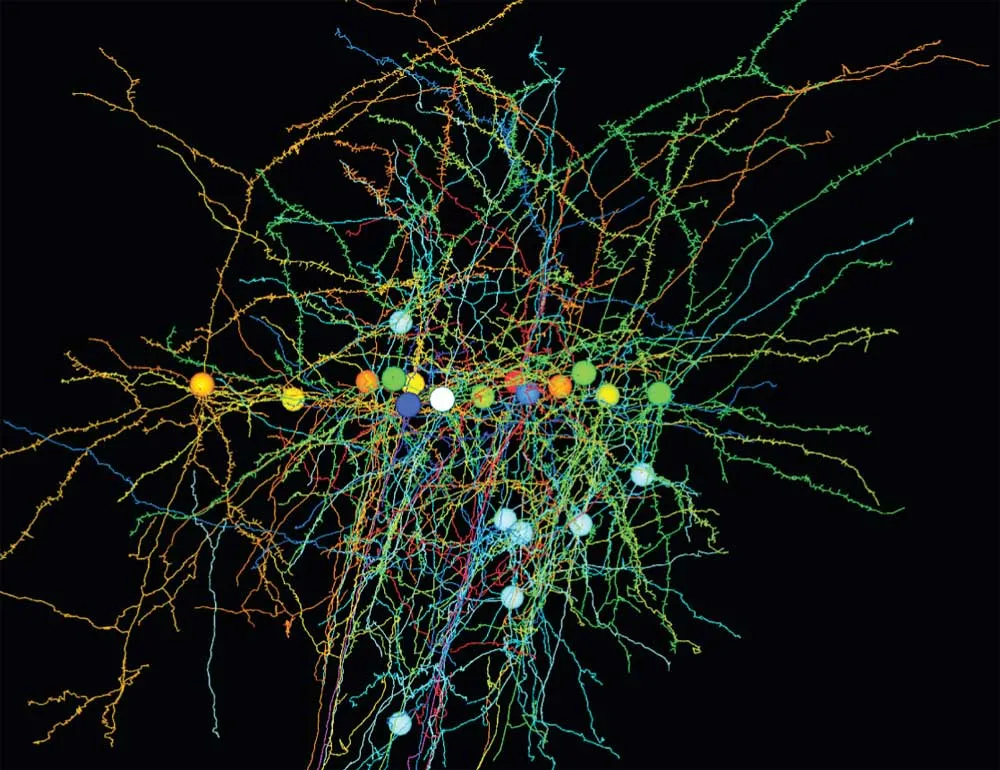
Active Genes

The three men's brains were first scanned with functional magnetic resonance imaging (fMRI) to capture their precise anatomical details. The researchers then cut up the brain into many tiny slices and chemically analyzed genetic activity within about 900 precise areas. Shown here, a 3D rendering from showing the expression a single gene in the internal structures of the human brain overlaid onto magnetic resonance imaging (MRI) data. The level of gene expression at the different points (dots) is indicated on a color scale, with blue reflecting relatively low expression and red reflecting high expression.
Brain Blueprint

The researchers found that genetic activity was remarkably similar between the two complete brains, suggesting a strong underlying common genetic blueprint for the human brain. Shown here, another 3D rendering that shows the expression of a single gene, with blue dots indicating low expression and red, high expression.
Brain Blocks

The three men's brains were first scanned with functional magnetic resonance imaging (fMRI) to capture their precise anatomical details. The researchers then cut up the brain into many tiny slices (a human-brain slab shown here cut into blocks) and chemically analyzed genetic activity within about 900 precise areas. Blue dots helped to track orientation, and all tissue subdivisions were tracked to allow virtual reassembly into a unified 3-D anatomic framework.
The Neocortex

A 3D rendering of the expression a single gene across the cortex of two human brains in the Allen Human Brain Atlas, revealing areas with higher (red) and lower (green) expression. Results showed gene activity was remarkably similar throughout the brains' neocortex, or the center of higher mental function in humans.
Get the world’s most fascinating discoveries delivered straight to your inbox.
