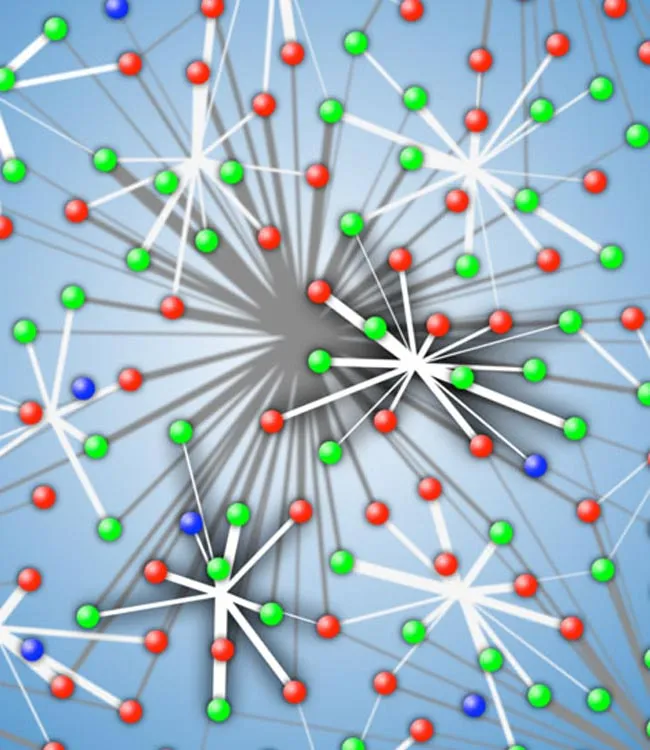
Colors can be categorized as reddish or greenish, but rarely ever both. The same is true of yellow and blue. Now a new eye map shows how these hues are like oil and water in our brains.
These relationships, called opponencies, are a fundamental characteristic of our ability to see color.
Sight begins when light from the outside world travels to the retina, in the back of the eye, where receptor cells respond. These receptors are rods, which pick up on dim light, and cones, which respond to long, medium and short wavelengths of light. We perceive these wavelengths as red, green and blue, respectively.
Latest Videos FromLive Science
The signals from the cones travel into neurons called retinal ganglion cells. These cells compare activity between long- and medium-wavelength-sensitive cones — for red/green opponency — and between short- and a combination of medium- and long-wavelength-sensitive cones – for blue/yellow opponency. The result is a color signal that travels back to the brain.
"The mechanism by which this comes about has been obscure and widely debated," said E.J. Chichilnisky, a neurobiologist at the Salk Institute for Biological Studies in California. Chichilnisky was part of a team of researchers that diagrammed the connections between the cones and the retinal ganglion cells.
The researchers included an international team of high-energy physicists who developed a neural recording system to capture the tiny electrical signals generated simultaneously by hundreds of retinal ganglion cells. This took place after the cones were stimulated with light, Chichilnisky said.
The creation of a diagram outlining connections between five types of retinal ganglion cells and the three types of cones — the first complete characterization of a circuit in a vertebrate nervous system — is the most important aspect of the work, Chichilnisky told LiveScience.
"Until you see all the cells in the network functioning simultaneously, you have a lot of questions about what is going on in the parts you are not seeing," he said.
The diagram revealed different patterns for the red/green opponency and the yellow/blue opponency, and provided new information about the roles of particular retinal ganglion cells.
For example, a type of midget ganglion cell received strong input from short-wavelength-sensitive cones (responsible for the color blue). This was a surprise considering these cells play a role in red/green color vision. Also, both types of midget ganglion cells received input in a fashion that specifically heightened the red/green color signals sent to the brain, according to Chichilnisky.