 Live Science Plus


Best Gravity Map Yet Shows a Lumpy, Bumpy Earth
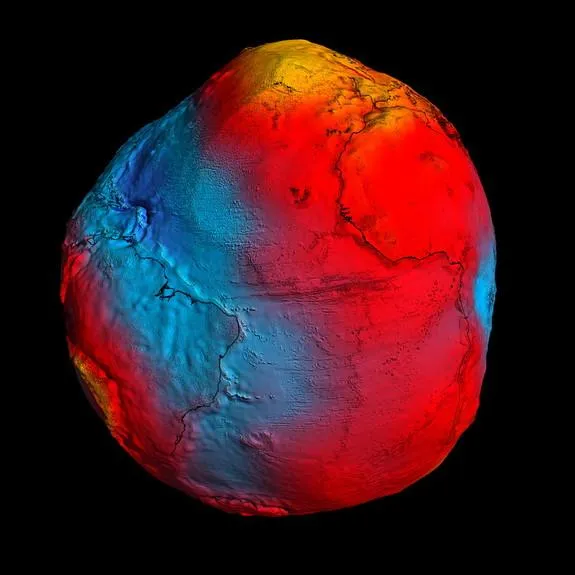
Take a clay model of Earth and squish it with your fingers, and the result may look similar to the geoid the latest and best-ever map of our planet's gravitational field.
The latest Earth gravity map is the most accurate model of gravity fluctuations around the world. It was recorded by the European Space Agency's GOCE satellite, whose instruments show Earth as a lumpy, multi-colored mesh of high and low points.
That's because gravity is not the same at all points on Earth; more massive features have a stronger pull. [6 Weird Facts About Gravity]
Article continues below"If Earth were a sphere and its density constant, then gravity would be the same everywhere," Reiner Rummel, Chairman of the GOCE Mission Advisory Group, told SPACE.com in an email interview when the geoid was unveiled earlier this year.
But that's not the case.
The solid, rocky crust under the continents is almost 20 miles (32 kilometers) thick, while the crust beneath the ocean spans just 6 miles (10 km). Some regions contain lighter materials, some heavier. Actions within the mantle cause variations in density.
All of these factors result in Earth's gravity being stronger at some points than others, researchers said.
Measuring Earth's gravity
Circling Earth lower than any other observational satellite, the ESA's Gravity field and steady-state Ocean Circulation Explorer (GOCE) mapped the geoid by using its own orbit as a tool.
"When the satellite approaches, for example, the Alps, the mountains pull the satellite slightly towards them," explained mission scientist Roger Haagmans via email. "So by very precisely analyzing the orbit of the satellite, we learn about the scale effects of our gravity field irregularities."
GOCE also carries a gradiometer, which measures the numerical change of the magnetic field. The two together present a full picture of Earth's gravity.
Mapping the geoid helps scientists learn more about the Earth's oceans and climate. Combining the geoid with information on seismology and magnetism reveals more about the internal structure of the planet, including earthquake-related processes.
"In principle, the situation before the earthquake at a location where continental and oceanic plates meet and subduction [where one tectonic plate moves beneath another] takes place has a specific fingerprint in terms of gravity," Haagmans said. "After the earthquake, the plates have moved significantly and cause a different fingerprint."
Still gathering data
Comparing such before-and-after measurements helps scientists to refine their models and gain a greater understanding of earthquakes, researchers said.
While the geoid remains relatively constant overall, earthquakes, melting polar ice, and changes in sea level can all cause subtle changes. "The temporal variations are very small millimeters in the geoid but measureable," Rummel said.
Launched in March 2009, GOCE finished its main gravity-mapping mission six weeks ahead of schedule. But it will continue to study the planet's gravity through 2012, allowing for even more precise measurements.
This article was provided by SPACE.com, a sister site to OurAmazingPlanet. Follow SPACE.com for the latest in space science and exploration news on Twitter @Spacedotcom and on Facebook.

