


Satellites See Extreme Extent of US Drought
Much of the United States has been in the grip of drought for months, with a whopping two thirds of the contiguous states experiencing some level of drought in August, as seen in a new NASA satellite map.
In July, just under 56 percent of the country was experiencing drought conditions, a record. In August, 39 percent of the nation suffered from severe to extreme drought, according to the U.S. Drought Monitor. The numbers have changed slightly since late summer, but drought is still a big concern for much of the country, according to a NASA statement.
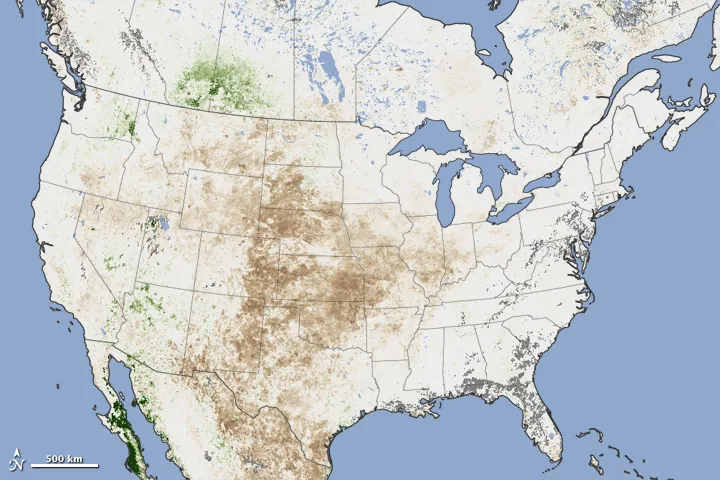
The Moderate Resolution Imaging Spectroradiometer (MODIS) on NASA's Terra and Aqua satellites took data on plant health across the country (and Mexico and Canada) in August. NASA scientists compared it to data taken in 2002 to create a "vegetation anomaly map" that shows where plant growth is below normal (the brown areas) and above normal (the few green spots). (Grays are areas where data wasn't available.)
The map is based on the Normalized Difference Vegetation Index (NDVI), a measure of how plant leaves absorb visible light and reflect infrared light, the NASA statement said. Drought-stressed vegetation reflects more visible light and less infrared than healthy vegetation.
The map is a striking reflection of the seriousness of this year's drought. In August 2012, the NDVI was strongly negative (meaning plant growth was down) from the Rocky Mountains, across the Great Plains to the Mississippi and Ohio River valleys. Much of northern Mexico appeared to be drought-stricken as well. A few patches of above-normal growth appear in Canada's Alberta and Saskatchewan provinces; in Arizona and Nevada; and along the shores of the Gulf of California in Mexico.
The 2012 drought is the worst observed since the U.S. Drought Monitor began operating in 2000.
"By far, this is the driest year we have seen since the launch of MODIS," said Molly Brown, a vegetation and food security researcher at NASA’s Goddard Space Flight Center.
Get the world’s most fascinating discoveries delivered straight to your inbox.
This story was provided by OurAmazingPlanet, a sister site to LiveScience.
