Just two centuries ago, the world lacked a single geologic map. The chronology of the planet's history was unknown and effectively invisible to people despite the evidence of rock layers at cliffs and canyons.
Theological maps of the world then depicted such biblical concepts as the Garden of Eden. Some people believed that mountains grew organically like trees.
The study of nature and rocks was a novelty. Thinkers in the early 1800s disagreed over the age of the Earth, with some standing by Bible-based estimates of 6,000 years old.
Latest Videos From
Then along came the map that changed the world.
On display now
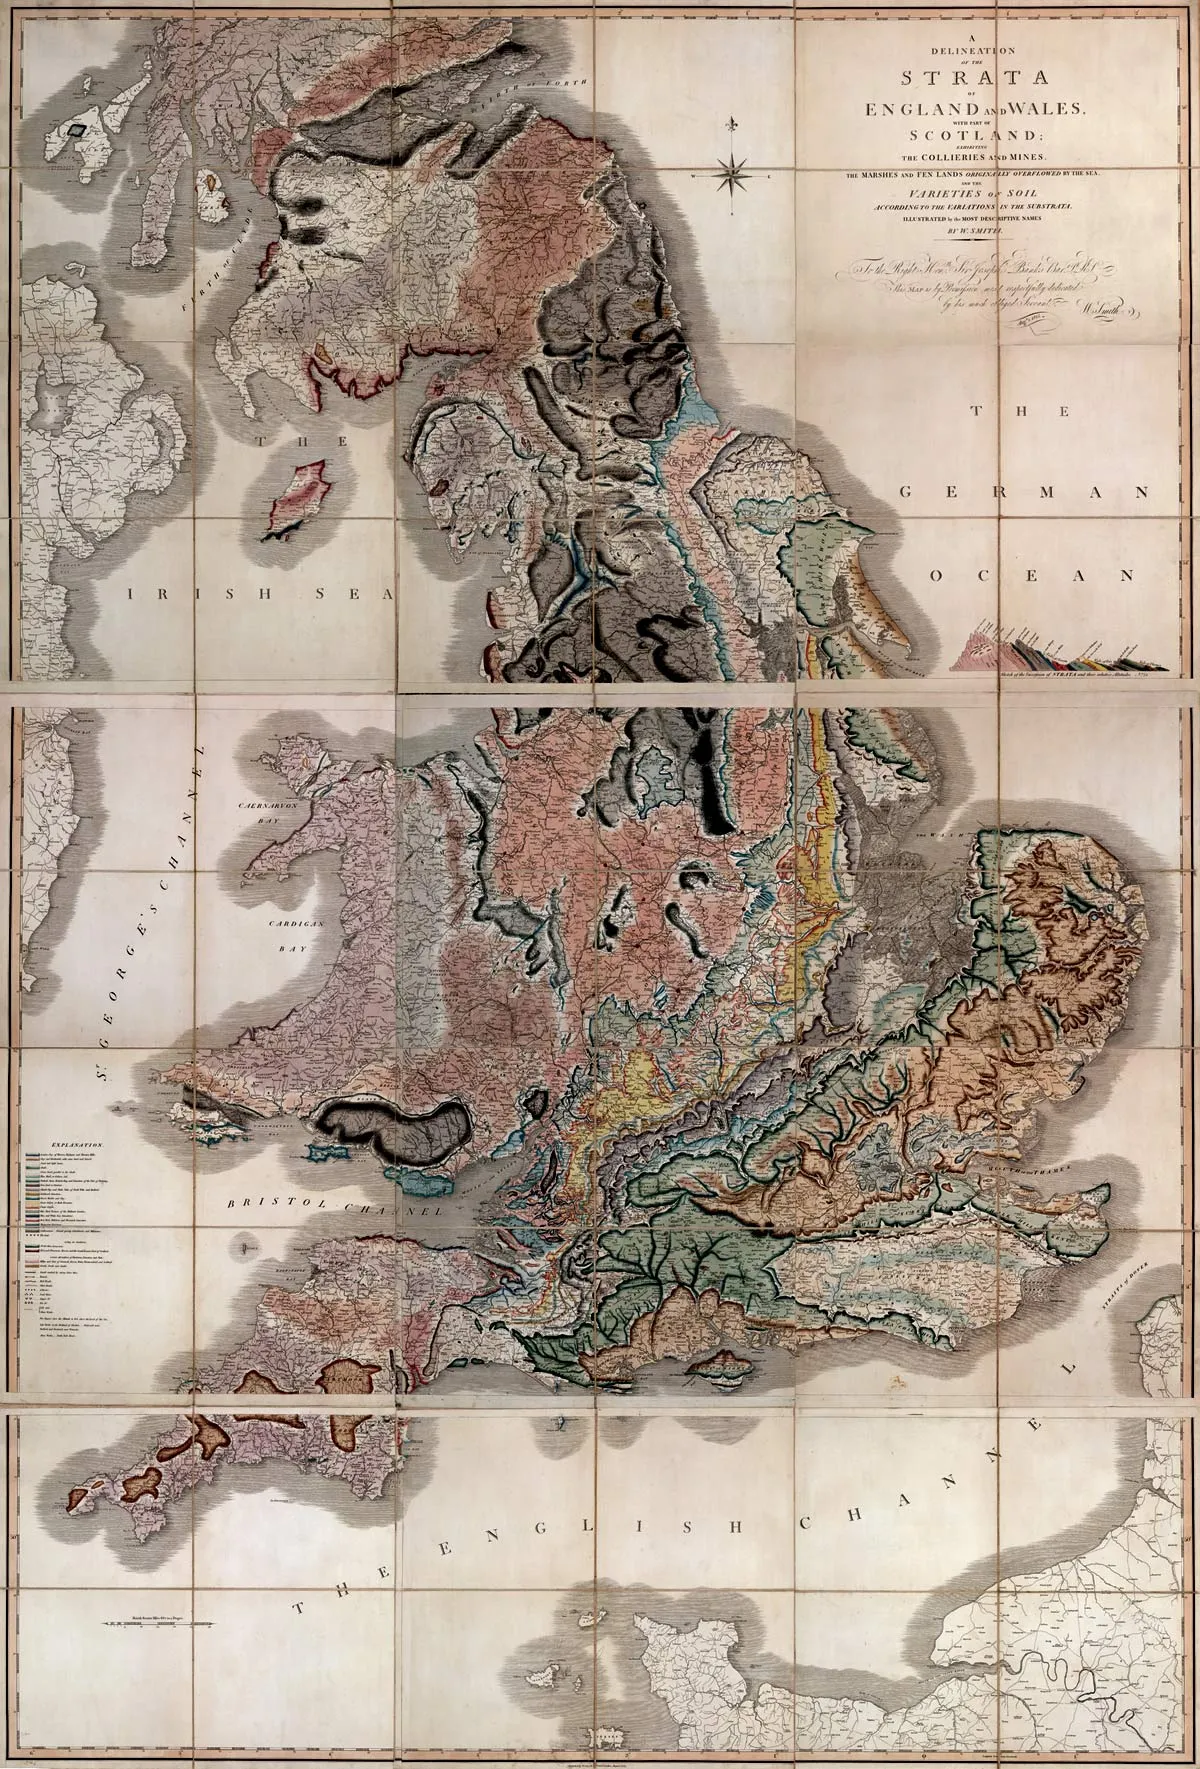
Created in 1815, the world's first geologic map measures 10 by 16 feet and illustrates the individual rock layers that underlie Great Britain. One of only two U.S. copies is now on public display for the first time at the Buffalo and Erie County Public Library in New York State.
Only 43 copies of the map still exist. The only other U.S. copy is at the Library of Congress and it is not on public display.
In addition to the map, canal surveyor William Smith created a series of sketches and descriptions of the fossils found within each specific layer of rock. There are only 11 surviving copies of these pamphlets in the world.
"If geology were a religion, this map would be its bible," said University of Buffalo geologist Robert Jacobi.
The birth of geology
Explorers back then had sketched estimates of increasingly accurate land-mass outlines for navigation, but Smith was the first to create a map that showed how surface rocks tell what lies beneath.
The map opened up the field of geology, and later biology and natural history. And today, scientists know that Earth is about 4.5 billion years old.
Scholars 200 years ago fell into two camps – uniformitarians who thought rocks were laid down by water in layers over time and catastrophists who thought the Earth and its rocks were deposited by floods or volcanoes. The former group was closer to the truth.
Jacobi's University of Buffalo colleague Tracy Gregg says she wouldn't be surprised if hundreds of geologists make the trip to chilly Buffalo to see this rare document.
Gregg says that Smith could "read" the rocks on the surface. He realized that Earth's processes are cyclical, not random.
Painstaking production
Smith traveled by foot and on horseback throughout Great Britain to make observations that led to his map, which he hand drew and colored in, eventually producing 400 original copies. The printing took two years.
"The black lines on the map could be mass produced, yes," Gregg told LiveScience, "but all the individual rock layers were assigned their own colors … and every map had to be hand-colored—a time-consuming, painstaking process.
"The map is a tool, a mechanism for communicating how you can peel back the layers of dirt, gravel and grass and see what's underneath," Gregg said. "So you can tell somebody, go to this spot on this street corner and this is what you will find."
The map will be on view through December. More information on the exhibit is available here.