It's quick and easy to access Live Science Plus, simply enter your email below. We'll send you a confirmation and sign you up for our daily newsletter, keeping you up to date with the latest science news.
You can't normally see water currents or the wind. Now you can: A computer code used to visualize wind has been adapted by researchers to show surface currents of the Great Lakes.
The code was originally developed to make a map of the wind by Fernanda Viégas and Martin Wattenberg, artists/technologists who lead Google's "Big Picture" visualization research group in Cambridge, Mass., according to their website.
But researchers at the Great Lakes Environmental Research Laboratory in Michigan saw the stunning wind map and figured it could be applied to surface currents of the Great Lakes, which are largely driven by wind. They were right. And, luckily for them, Viégas and Wattenberg agreed to share their code.
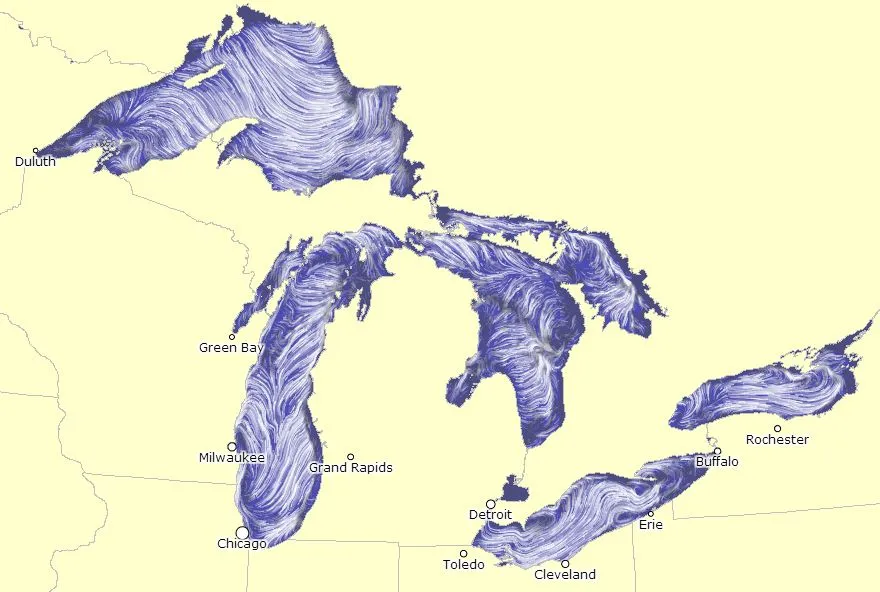
The result? A stunning map of surface currents on the Great Lakes, as shown in this screenshot of the map on the laboratory's website from this afternoon (Oct. 3).
The code uses a computer model to visualize wind patterns, said David Schwab, a researcher at the laboratory who's in charge of the map. The model is based on measurements of wind speed, air temperature and other variables at weather stations and buoys around the Great Lakes, Schwab told OurAmazingPlanet. It's updated four times per day.
"I think a lot of people never realized how variable the currents are in the lakes," Schwab said. He thinks the map will be useful for recreational boaters, fishermen and the shipping industry, as well as for generally increasing people's knowledge of the Great Lakes, he said.
Faster currents are shown as thicker white lines, and the speed of the current can be determined by zooming in on individual lines.
Sign up for the Live Science daily newsletter now
Get the world’s most fascinating discoveries delivered straight to your inbox.
Another view of the currents on the surface of Lake Michigan and other nearby lakes, taken from the website on Oct. 3, 2012.
(Image credit: NOAA Great Lakes Environmental Research Laboratory)
Douglas Main loves the weird and wonderful world of science, digging into amazing Planet Earth discoveries and wacky animal findings (from marsupials mating themselves to death to zombie worms to tear-drinking butterflies) for Live Science. Follow Doug on Google+.