All farmers on the ground know their land as well as their own wrinkled hands, but totaling up all the world's cropland is a difficult task. Yet the competition for land among developers, growers and other parties makes getting an accurate count of the world's arable acres especially important as the planet's population grows.
Two new maps released Friday (Jan. 16) considerably improve estimates of the amount of land farmed in the world — one map reveals the world's agricultural lands to a resolution of 1 kilometer, and the other provides the first look at the sizes of the fields being used for agriculture, the researchers said. Earlier studies estimated that the world's cropland may cover an area between 1.22 billion and 1.71 billion hectares, a range that varies by more than 40 percent.
"The field-size map is really unique — no such global product currently exists," study co-author Linda See, a researcher at the International Institute for Applied Systems Analysis in Austria, said in a statement.
The researchers built the cropland database by combining information from several sources, such as satellite images, regional maps, video and geotagged photos, which were shared with them by groups around the world. Combining all that information would be an almost-impossible task for a handful of scientists to take on, so the team turned the project into a crowdsourced, online game. Volunteers logged into "Cropland Capture" on a computer or a phone and determined whether an image contained cropland or not. Participants were entered into weekly prize drawings. [Farming in America (Infographic)]
The new global cropland map shows the extent of land dedicated to farming in 2005, and the field-size map illustrates different approaches to farming. It turns out that medium and large fields dominate in North America, central South America, Europe and Australia, while small fields pepper the farming regions in Africa, India, Southeast Asia and China.
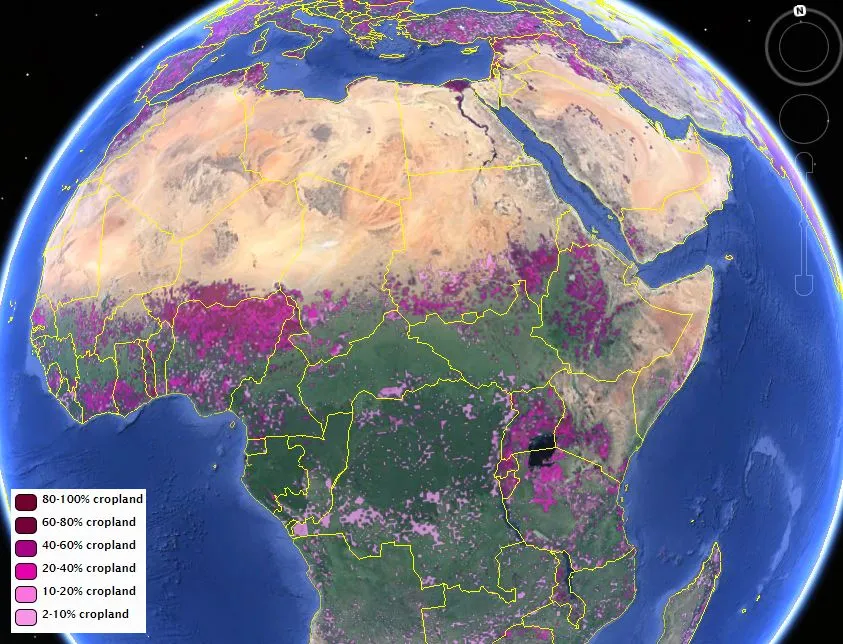
A satellite image showing agricultural field sizes in Africa.
(Image credit: IIASA Geo-Wiki Project; Google)
The researchers said they hope the global cropland map will become a reference map for climate modelers, as well as agencies that monitor and report on agricultural development worldwide. The field-size map is more a rough first step in looking at the world's fields, but offers a new way to monitor global agriculture, the scientists said. For instance, a growth in field sizes in a certain region could reflect a shift there toward development and mechanization.
"Current sources of information on cropland extent are not accurate enough for most applications," study lead author Steffen Fritz said in the statement. "The global cropland map is a low-cost solution to fill this need."
Sign up for the Live Science daily newsletter now
Get the world’s most fascinating discoveries delivered straight to your inbox.
Both maps are free to download from the "Cropland Capture" game host website, called Geo-Wiki, with online registration. The researchers are now producing a new cropland map for 2010, and updating the field-size map, they said.
The maps were also published in the journal Global Changes Biology.
Becky Oskin covers Earth science, climate change and space, as well as general science topics. Becky was a science reporter at Live Science and The Pasadena Star-News; she has freelanced for New Scientist and the American Institute of Physics. She earned a master's degree in geology from Caltech, a bachelor's degree from Washington State University, and a graduate certificate in science writing from the University of California, Santa Cruz.