Map of Winter Storm Jonas' Wind Shows Destructive Gusts

Winter storm Jonas brought with it record-breaking amounts of snow and blustering winds when it plowed through the northeastern and mid-Atlantic United States in late January. Now, scientists at NASA have created a new map showing the direction and speeds of the massive storm's wind gusts.
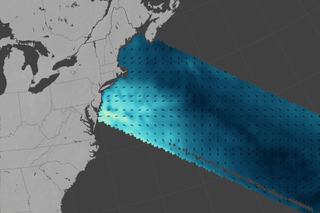
The map, released by NASA's Earth Observatory on Jan. 29, shows especially strong winds along the coasts of Maryland, Delaware and southern New Jersey.
Winds during winter storm Jonas wreaked havoc in coastal areas, with some gusts reaching 90 mph (145 km/h) — strong enough to be considered hurricane-force winds, according to NASA. The arrows on the map represent wind direction, and the shades of blue indicate wind speeds increasing from dark to light blue. [Winter Storm Photos: Watch Jonas Wallop the Eastern US]
But the new map does not use direct measures of wind speed and direction. Instead, it is based on data from RapidScat, a sensor mounted on the International Space Station.
RapidScat measured microwave pulses that were reflected off the ocean surface back toward the sensor. Waters that were disturbed more by the wind returned a strong signal, while calmer waters returned a weak signal, allowing scientists to infer wind speed and direction based on the position and roughness of the waves, NASA officials said. RapidScat is an important tool for meteorologists, because maximum sustained winds are not always equally distributed in a storm, agency officials added.

As the storm worsened on Jan. 23, the formidable winds caused a storm surge, or an abnormal rise of the water level, leading to significant coastal flooding. Along the New York Harbor area, the storm surge added around 3 feet (0.9 meters) to the normal tides, said Patrick Maloit, a meteorologist at the National Weather Service.
The massive storm caused historic coastal flooding and widespread power outages in New Jersey. The town of Cape May, New Jersey, experienced its highest coastal flood on record, beating the levels that resulted from Hurricane Sandy in 2012, according to Gary Szatkowski, another meteorologist for the National Weather Service.
Sign up for the Live Science daily newsletter now
Get the world’s most fascinating discoveries delivered straight to your inbox.
Hurricane Sandy was pivotal in highlighting the problem of expanding coastal cities in the Northeast without adequate infrastructure to deal with extreme weather. With sea levels rising at a faster rate than ever before, according to climatologists at NASA, storms like Sandy and Jonas have the potential to cause even more devastation to both infrastructure and natural resources.
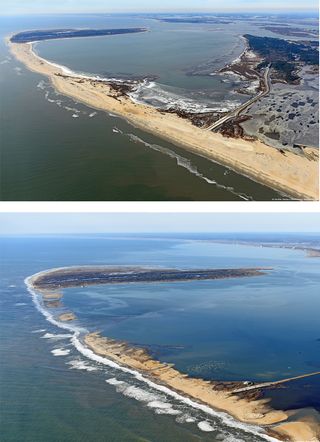
In Delaware, beaches in Rehoboth and Bethany lost sand dunes due to winter storm Jonas, according to news reports. And in Virginia, aerial photographer Patrick Hendrickson captured an image (above) of several new breaches in a beach on Assateague Island.
Sea-level rise and the resulting beach erosion hit especially close to home for NASA because half to two-thirds of NASA's assets stand within 16 feet (5 m) of sea level. In fact, the beach on Assateague Island helps protect launch infrastructure on Wallops Island, where several commercial and government rockets are launched each year — and it's increasingly threatened by rising sea levels.
Follow Knvul Sheikh on Twitter @KnvulS. Follow Live Science @livescience, Facebook & Google+. Original article on Live Science.
