By Viewers, World Cup Outpaces Super Bowl

This article was originally published at The Conversation. The publication contributed the article to Live Science's Expert Voices: Op-Ed & Insights.
It’s official: more people in the US are streaming the World Cup than this year’s Superbowl, so it’s no surprise sports channel ESPN this week reported a 46% increase in viewership in group round games from 2010 to 2014.
Particularly interesting in the discussion of streaming figures is that such activity is able to be measured in “streaming minutes” or “data transferred” – much more specific metrics than traditional audience figures.
Accurate global TV ratings are still a way off, considering the official FIFA World Cup 2010 Audience Report came out almost a year after the tournament.
Twitter and ratings are undeniably connected, but the extent of the correlation often depends of the type of broadcast: whether it’s a live sporting event, soap opera finale or reality television show.
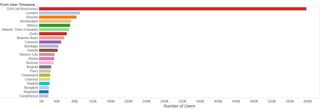
Indeed, a breakdown of the global tweets by timezone shows the dominance of US viewers in the Twitter conversation (including non-English hashtags):

Previous work by Nielsen has shown Sports, Reality TV and Comedy are genres where tweets have a causal relationship with viewer numbers, with Nielsen reporting that in 28% of sports programming measured, tweets had an impact on viewing numbers.
Sign up for the Live Science daily newsletter now
Get the world’s most fascinating discoveries delivered straight to your inbox.
As we contended in last week’s article, it’s possible viewers tweet when bored, as well as when excited, during a game. But it is also possible that those not watching the game are also tweeting about it, so any correlation between ratings and tweets, for sporting events, needs a bit more research.
Match tweets
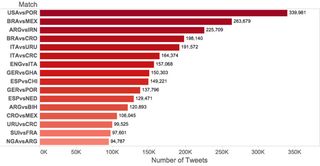
The US/World Cup love story continues in the graph below with the US vs Portugal match dominating match conversation for the week, and taking the lead in our “tweets by match” table.
ESPN also found that the:
USA vs Portugal contest on Sunday, June 22 is the most-viewed soccer match across all US television networks, averaging 18,220,000 viewers.

The top match in this graph has roughly a third more tweets than any match in the tournament so far, with top matches in previous weeks peaking at around 263,000.
It’s also possible from what we have discussed above that the Brazil vs Mexico match was bumped up by the large Mexican contingency located in the US timezones, as well as the enormous Brazil following on Twitter that we’ve seen in previous weeks.
The most talked-about event by far at the World Cup last week was the Luis Suarez bite.
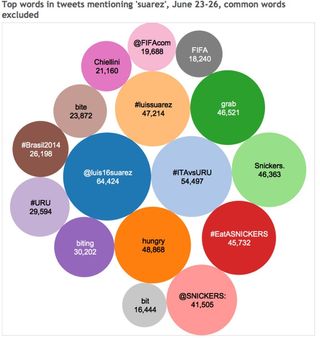
The bite followed two other incidents of Suarez biting in the past, creating a storm of online conversation that can be seen in the visualisation of the most common words in tweets mentioning Suarez (note also the prominence of “Snickers”, a recurring example of brand impact on the World Cup):

The controversy around the bite mostly relates to whether Suarez intentionally bit the other player or just fell in an unfortunate position making it look like he bit him – as some Uruguayans have argued. Again, asking the question of whether video-technology should be more widely used in the game as recently discussed by Miguel Sicart.
Diego Maradona, the Argentinian whose hand-ball goal in the 1986 World Cup sparked much controversy said:
This is football, this is incidental contact […] They have no commonsense or a fan’s sensibility. Luisito, we are with you.
And a Reuters report notes:
The referee did not spot the incident during the match, but FIFA’s rules allow the use of video or “any other evidence” to punish players retrospectively.
Indeed FIFA did punish Suarez, announcing a nine-match ban on June 26 (the second spike visible in the graph below):

While the correlation is clear between real-time events and Twitter, the graph above quantifies just how vocal Twitter users have been around the Suarez incident, with the bite generating more than 3,500 tweets per minute at peak.
The lower volume for the announcement of the ban is also a signifier of the number of people watching the game(s) live and tweeting, versus those who use Twitter as a more general information source or discussion platform about the World Cup.
The authors do not work for, consult to, own shares in or receive funding from any company or organisation that would benefit from this article. They also have no relevant affiliations.
This article was originally published on The Conversation. Read the original article. Follow all of the Expert Voices issues and debates — and become part of the discussion — on Facebook, Twitter and Google +. The views expressed are those of the author and do not necessarily reflect the views of the publisher. This version of the article was originally published on Live Science.
Most Popular

