What Is It Really Like Under the Indian Ocean?

This article was originally published at The Conversation. The publication contributed the article to Live Science's Expert Voices: Op-Ed & Insights.
Not long after the Malaysian Airlines flight MH370 was declared missing, the world’s attention was focused on a remote, poorly known area of the Eastern Indian Ocean as the possible location of the lost aircraft.
What this tragedy has highlighted is how little we know about the ocean floor.
This region, and for that matter much of our world’s oceans, are often described as poorly explored. But what do we mean by poorly explored and why do we know so little?
Exploring a region of the ocean typically involves travelling to an area on a ship and collecting detailed information. The data collected falls into two main categories:
- geological - anything about the seafloor and the material beneath
- oceanographic - all things in the water column, including its biology, chemistry, and physics
The view from above
What we currently know about the majority of the seafloor comes from data collected by satellites. This data enables us to construct global maps of ocean depth by inferring the shape of the ocean bottom from the shape of the water surface above.
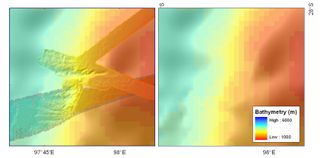
The problem is that these data don’t resolve features smaller than about 20 kilometers in diameter. This means that smaller features – even individual underwater mountains up to 1.5 km high – are sometimes not detected by the satellite measurements.
Sign up for the Live Science daily newsletter now
Get the world’s most fascinating discoveries delivered straight to your inbox.
In contrast, detailed depth measurements (bathymetry) collected by ships have a much higher resolution.
At the significant depths (between 3km and 6km) of the MH370 search region, typical resolutions are around 30m to 150m horizontally.

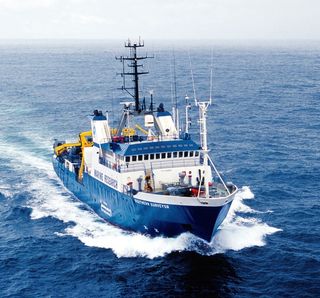
The image above shows the difference between the shape of the seafloor on the western flank of the Batavia Knoll, located in the southern portion of the MH370 search area, estimated from satellite data (left) and collected by Australia’s former Marine National Facility vessel, the RV Southern Surveyor in 2011 (right).
Unfortunately such detailed imagery is only available for roughly less than 10% of the global seafloor.

To obtain even higher resolution data, scanning equipment can be towed at depth behind a ship or mounted on autonomous underwater vehicles (AUVs). The closer the equipment is to the seafloor, the better it is able to resolve smaller features and more subtle detail.
What the maps show about the planet
Detailed maps of the seafloor are a powerful tool for scientists to investigate how and why the tapestry of underwater features are formed.
Ocean basins are created by motions of the tectonic plates over 10s and 100s of millions of years. When continents break apart, the story of their separation is recorded in the ocean floor that forms between them.
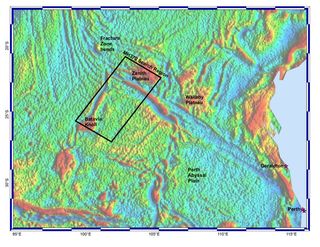
The eastern Indian Ocean formed as India and Australia separated around 100 million years ago, as part of the breakup of the southern supercontinent Gondwana. The seafloor that formed during this separation records details of the process, including many plateaus and linear features.

The black box in the image above shows the search area for flight MH370. The two plateaus in the search area, the northern Zenith Plateau and the southern Batavia Knoll, are approximately half the size of Tasmania.
But from satellite data alone, we cannot determine what formed these features. Are they the products of massive ancient volcanic eruptions? Or relatively small pieces of India left behind as India moved toward Eurasia?
These questions can only be answered by travelling to these regions on scientific research vessels that can map and sample the oceans in much greater detail.
Rocks from the deep
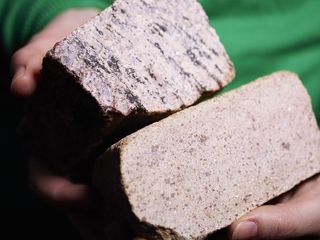
In 2011, we recovered the first ever seafloor samples from the Batavia Knoll. We wanted to know if the knoll was a piece of India left behind about 100 million years ago or if it formed from massive volcanic eruptions.

The samples we recovered were continental type rocks (erupted and oceanic rocks differ significantly in composition) which indicated that this piece had indeed rifted from India.
The Zenith Plateau still remains unsampled.
Nearby, there are other clues revealing the path that India took as it and Australia separated. Distinct curved lines to the left of the Zenith Plateau - labelled “Fracture zone bends” in the image above - record a dramatic change in the direction of India as it and Australia moved further apart 100 to 90 million years ago.
Why is this sort of information important? Because it helps build tectonic models of continental motions and formation of the continental shelves and deep ocean basins through time.
These models aid in understanding how Earth’s geography and climate has evolved over geological timescales, helping us to understand the planet’s habitability and predict future scenarios.
They also help us find new natural resources and fundamentally understand the dynamics of our planet.
Joanne Whittaker currently receives funding from the Australian Research Council. She has received ship time on Australia's Marine National Facility and funding from Statoil.
Simon Williams receives funding from the ARC, and has in the past been awarded ship time on Australia's Marine National Facility.
This article was originally published on The Conversation. Read the original article. Follow all of the Expert Voices issues and debates — and become part of the discussion — on Facebook, Twitter and Google +. The views expressed are those of the author and do not necessarily reflect the views of the publisher. This version of the article was originally published on Live Science.
Most Popular

